Tutorial: data management
In BioImageIT, data are represented using 3 levels:
Data: a single data is made of one or several data files described with metadata. A data can be a
RawDataif it comes from an acquisition system or aProcessedDataif it is a data obtained by processing any other data.DataSet: a collection of Data described with metadata. A dataset can contain a collection of
RawDataor a collection ofProcessedDatabut not a mixture ofRawDataandProcessedData.Experiment: contains one
RawDataSet, the images to be analysed, and a list ofProcessedDataSet, one for each process applied to the Data. The Experiment is described using metadata.
The BioImageIT application is a desktop graphical interface that allows to manipulate Data, Datasets and Experiments with a set of forms.
The more common usage of this application is following this data manipulation steps:
Create an Experiment
Import data to the Experiment
Annotate Data
Process data.
with goings and coming between steps 2 to 4
This first tutorial cover the step 1, 2 and 3.
Open the BioImageIT application:
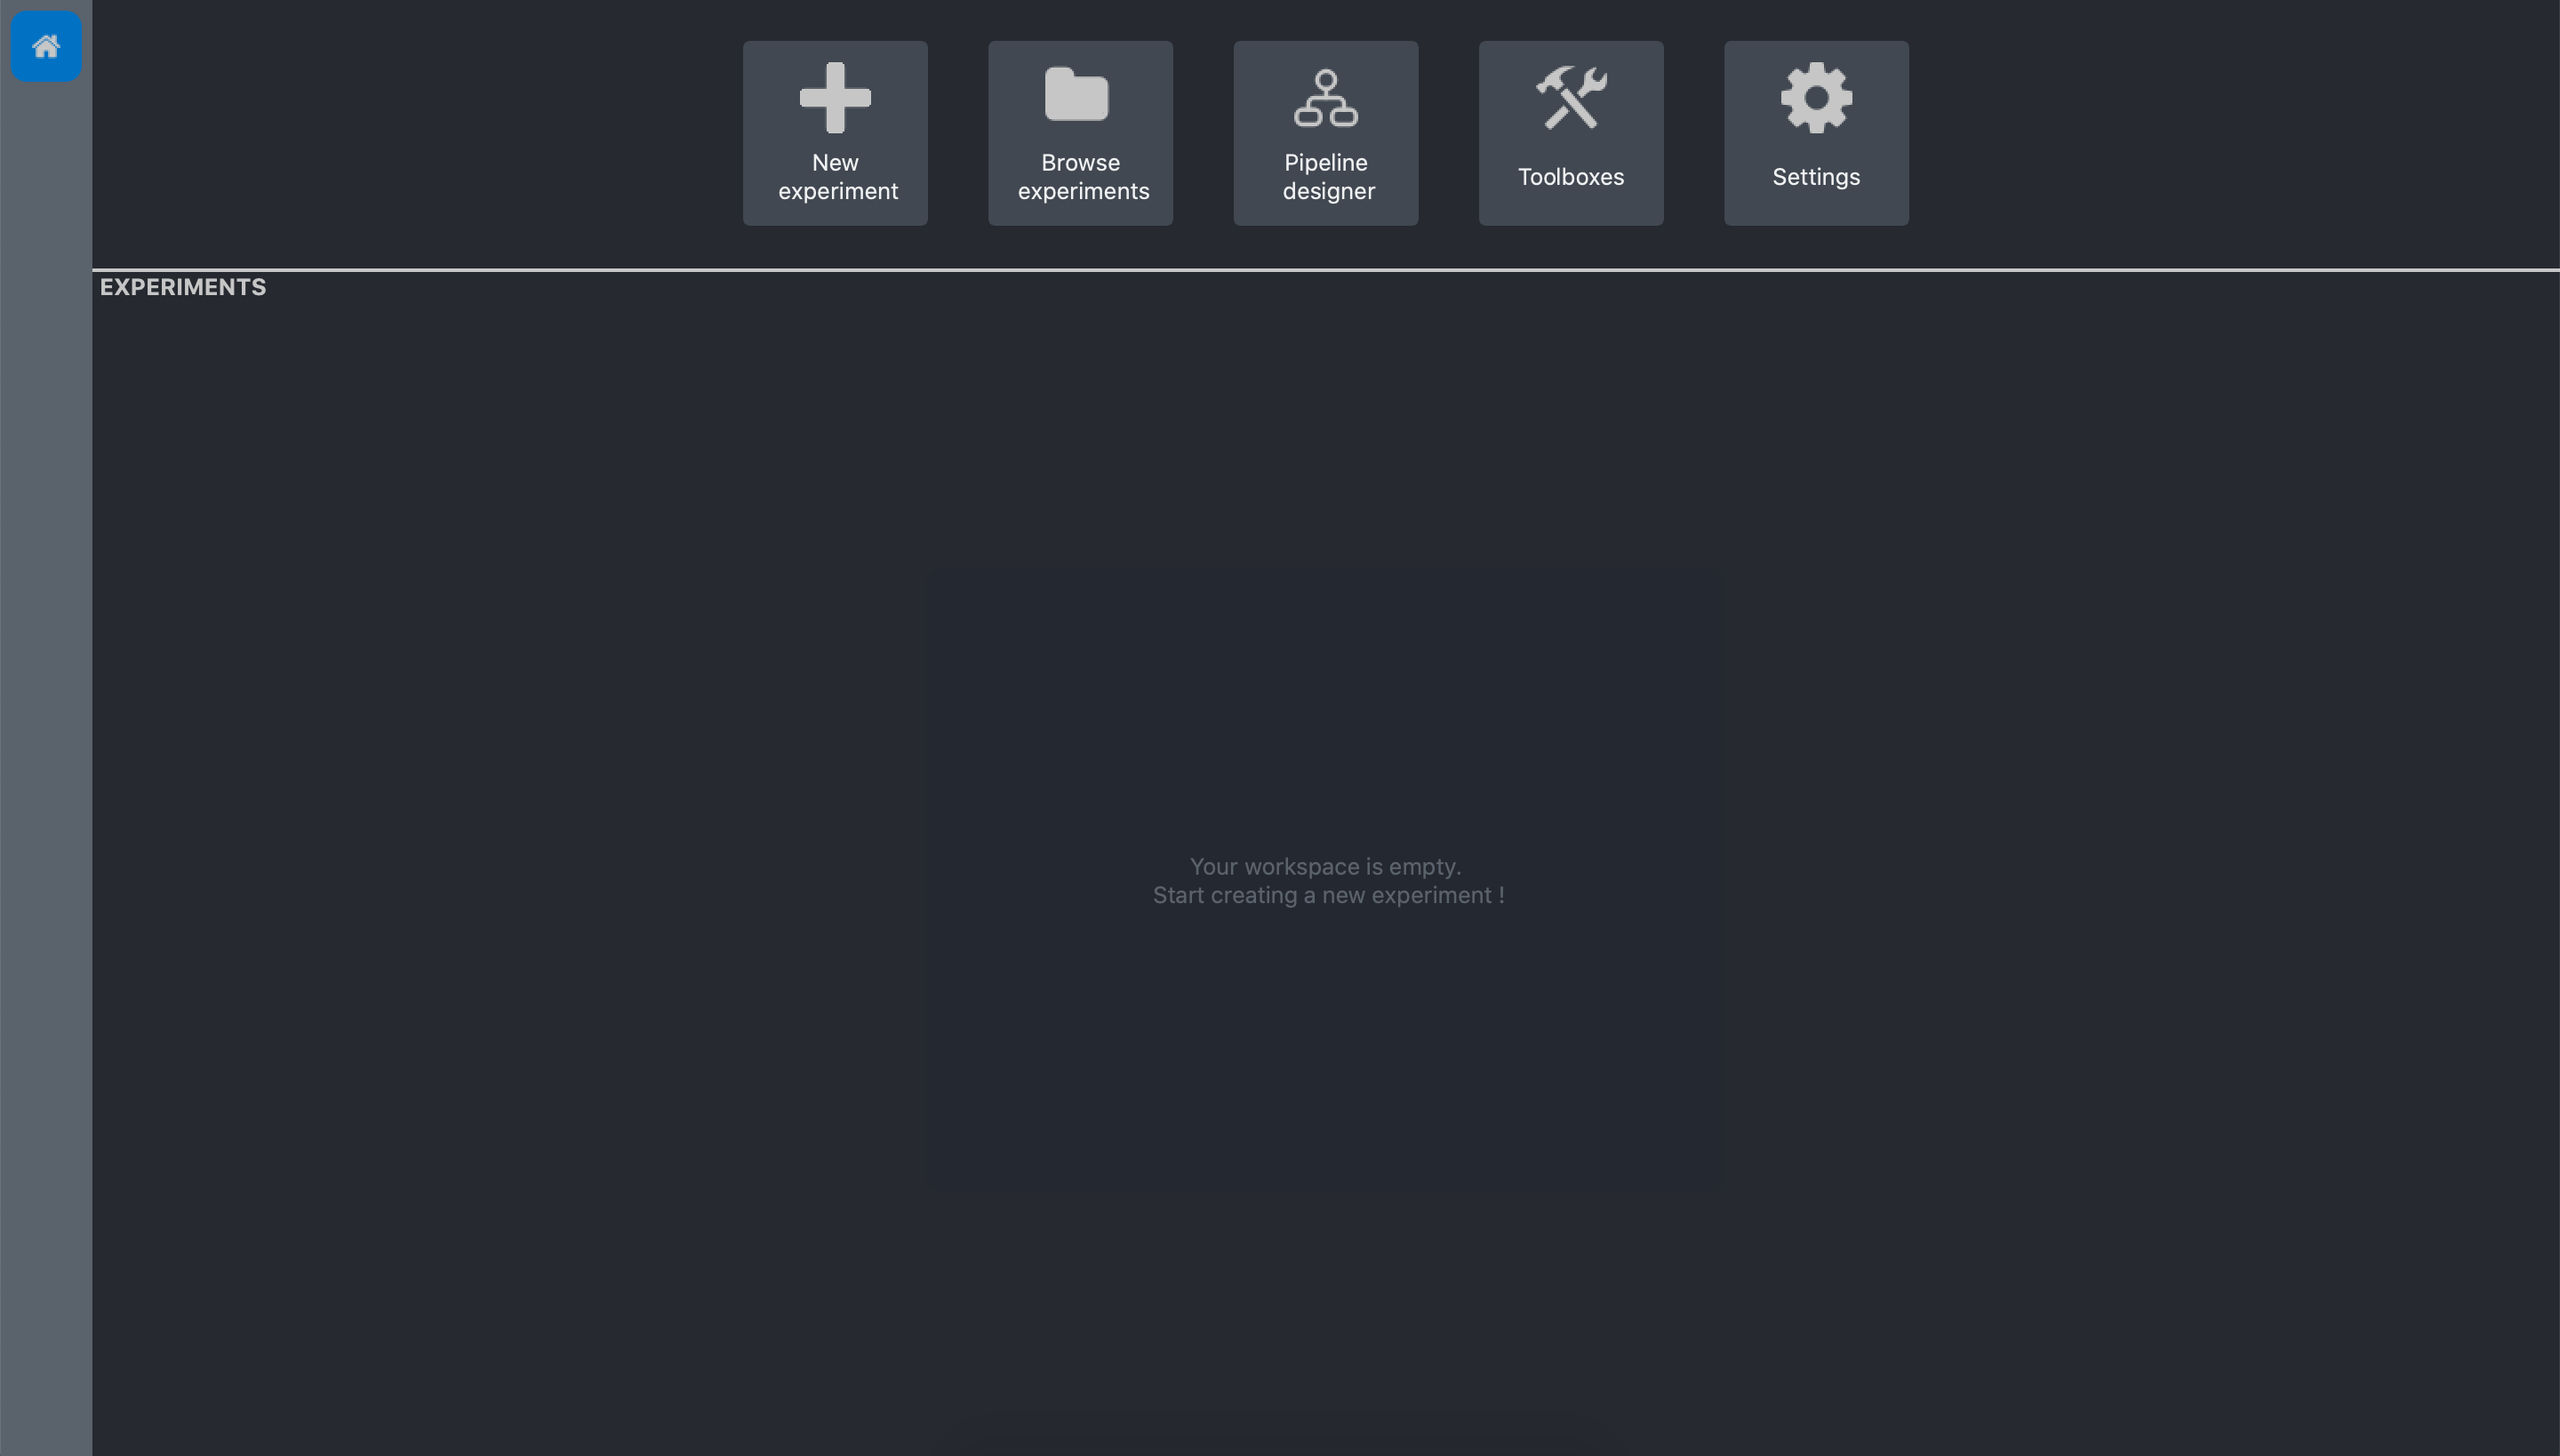
The home screen contains the avialable tools (New experiment, Browse experiments…) and the list of the previously created experiments that is empty at the first use.
Create the experiment
Click on the New expriment button. The new experiment form opens:
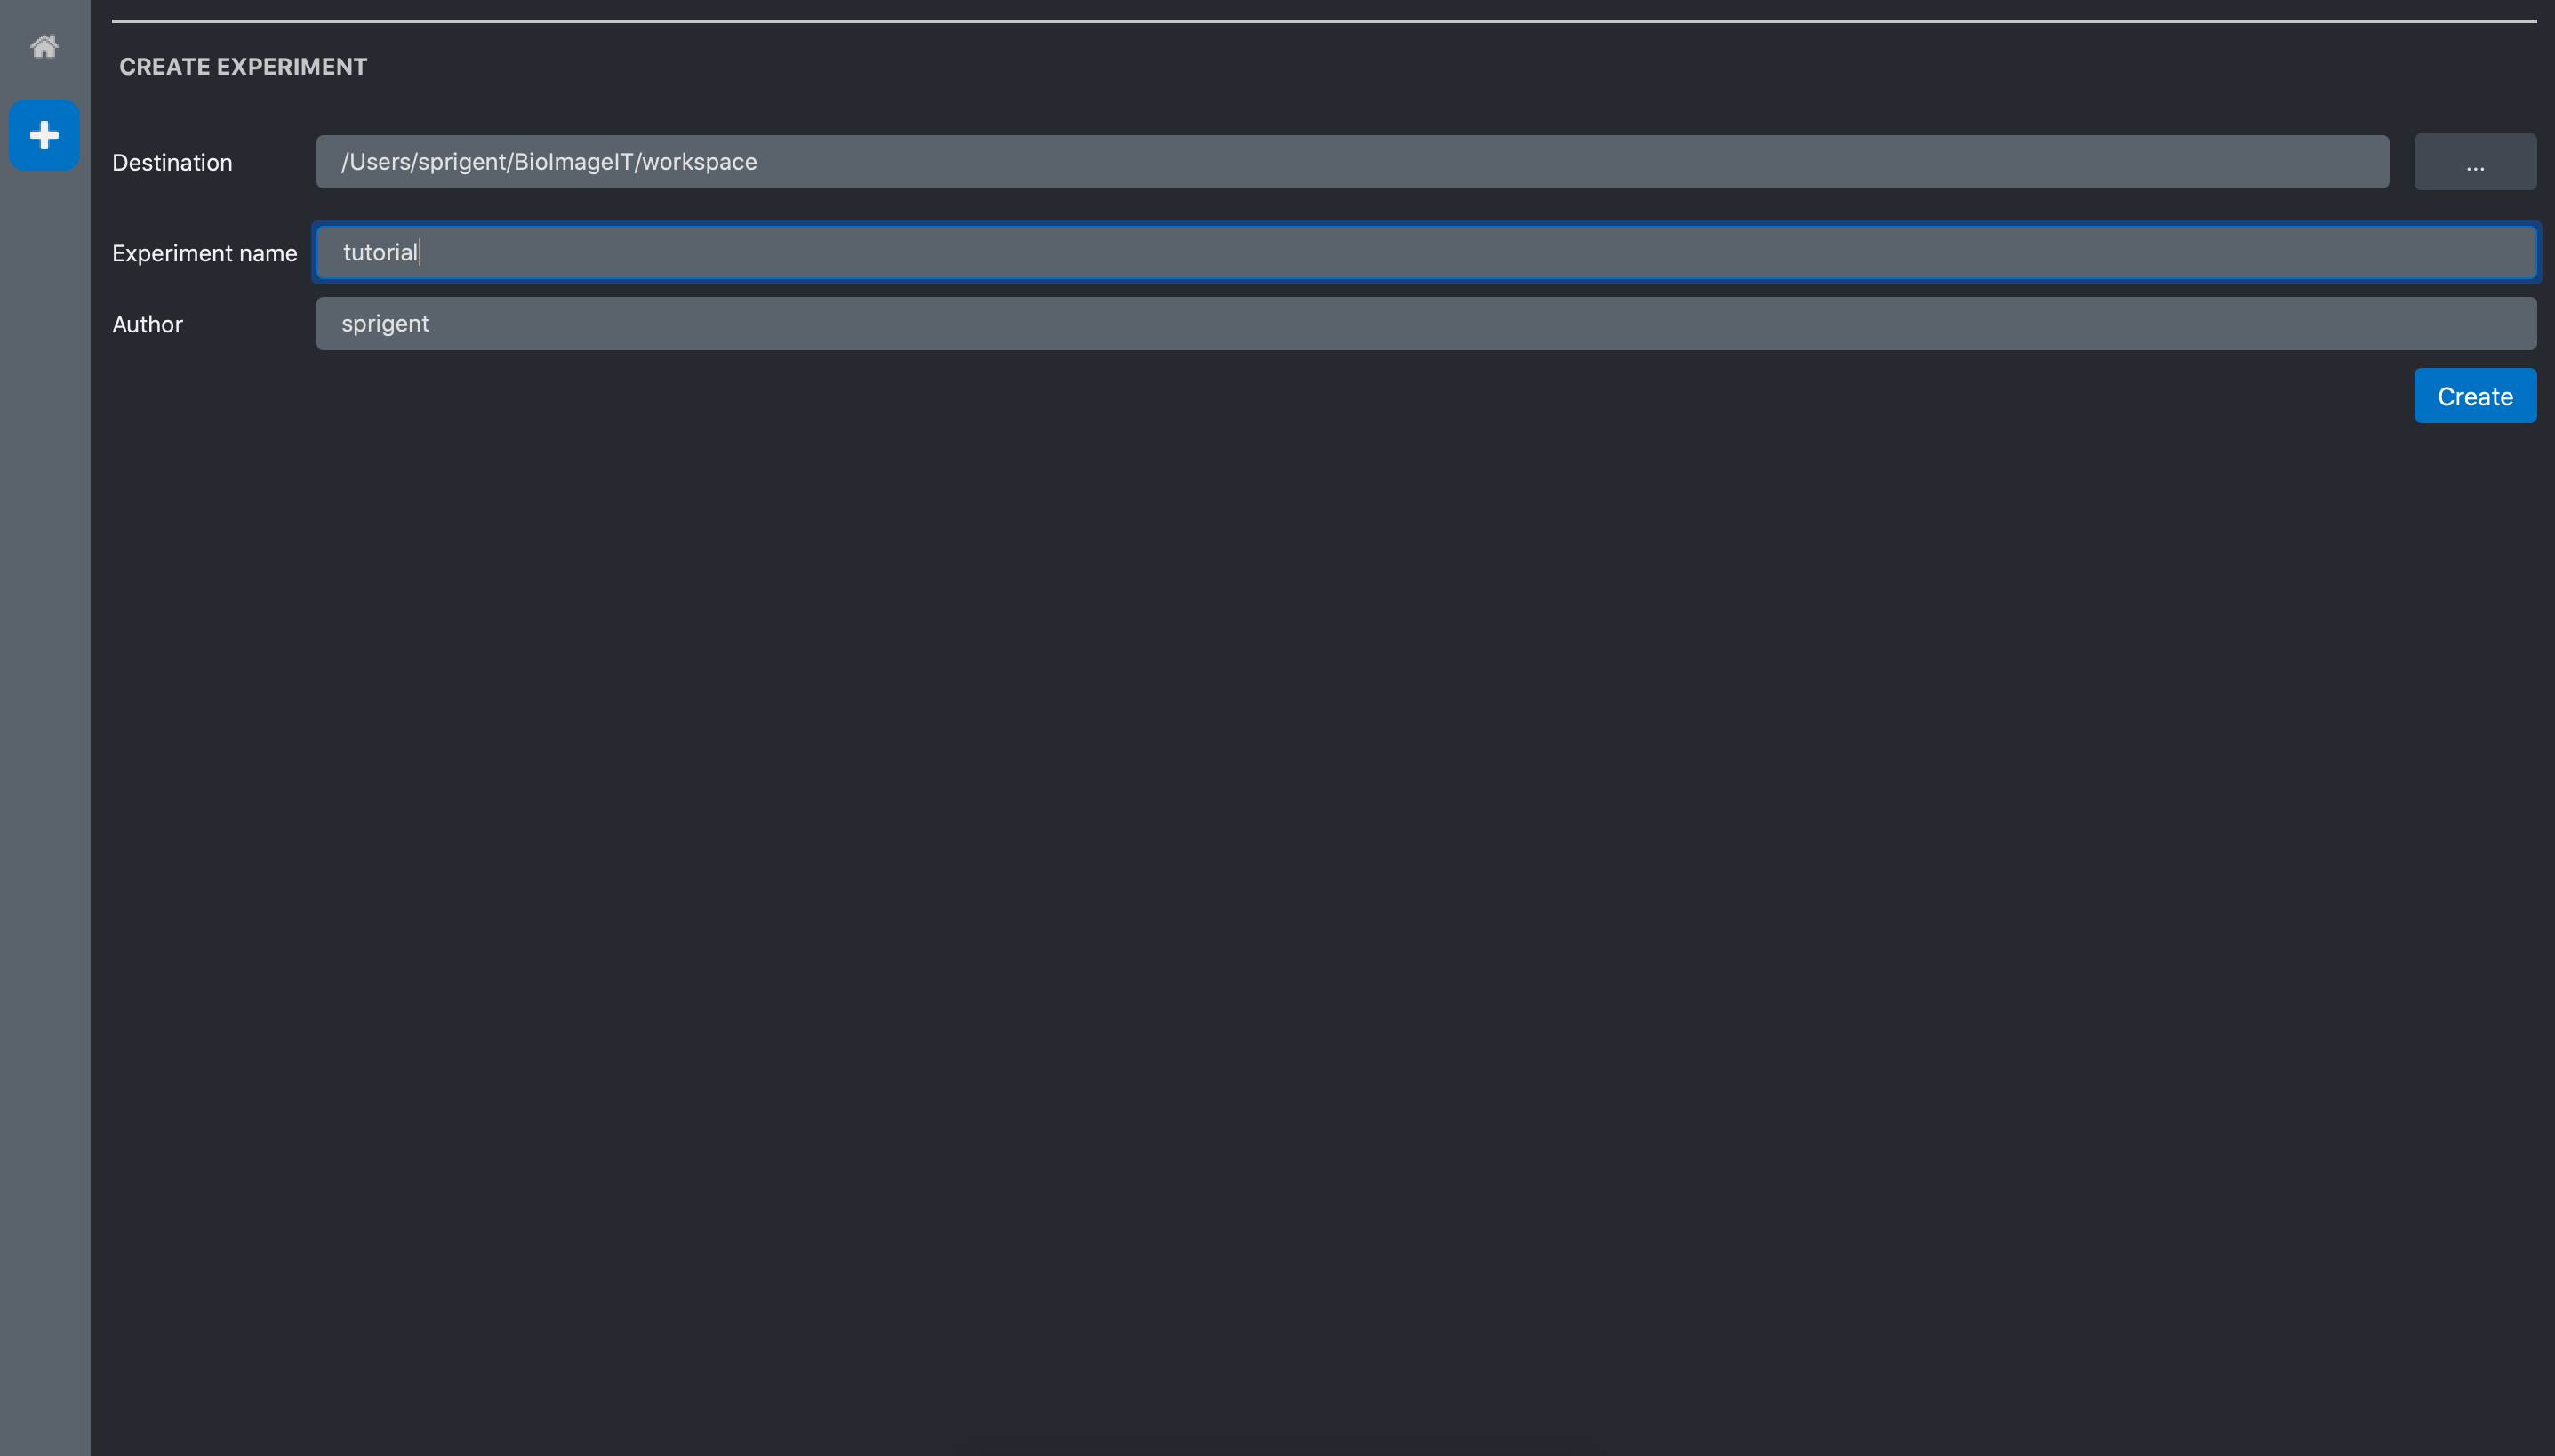
They are 3 fields. The destination is the directory where the experiment will be saved. By default it is in the BioImageIT workspace dir. The name is the name of the experiment. We call it tutorial for the tutorial experiment. Finally, the author is the name of the person who do the experiment. By default it is the username of the computer session.
Click the Create button.
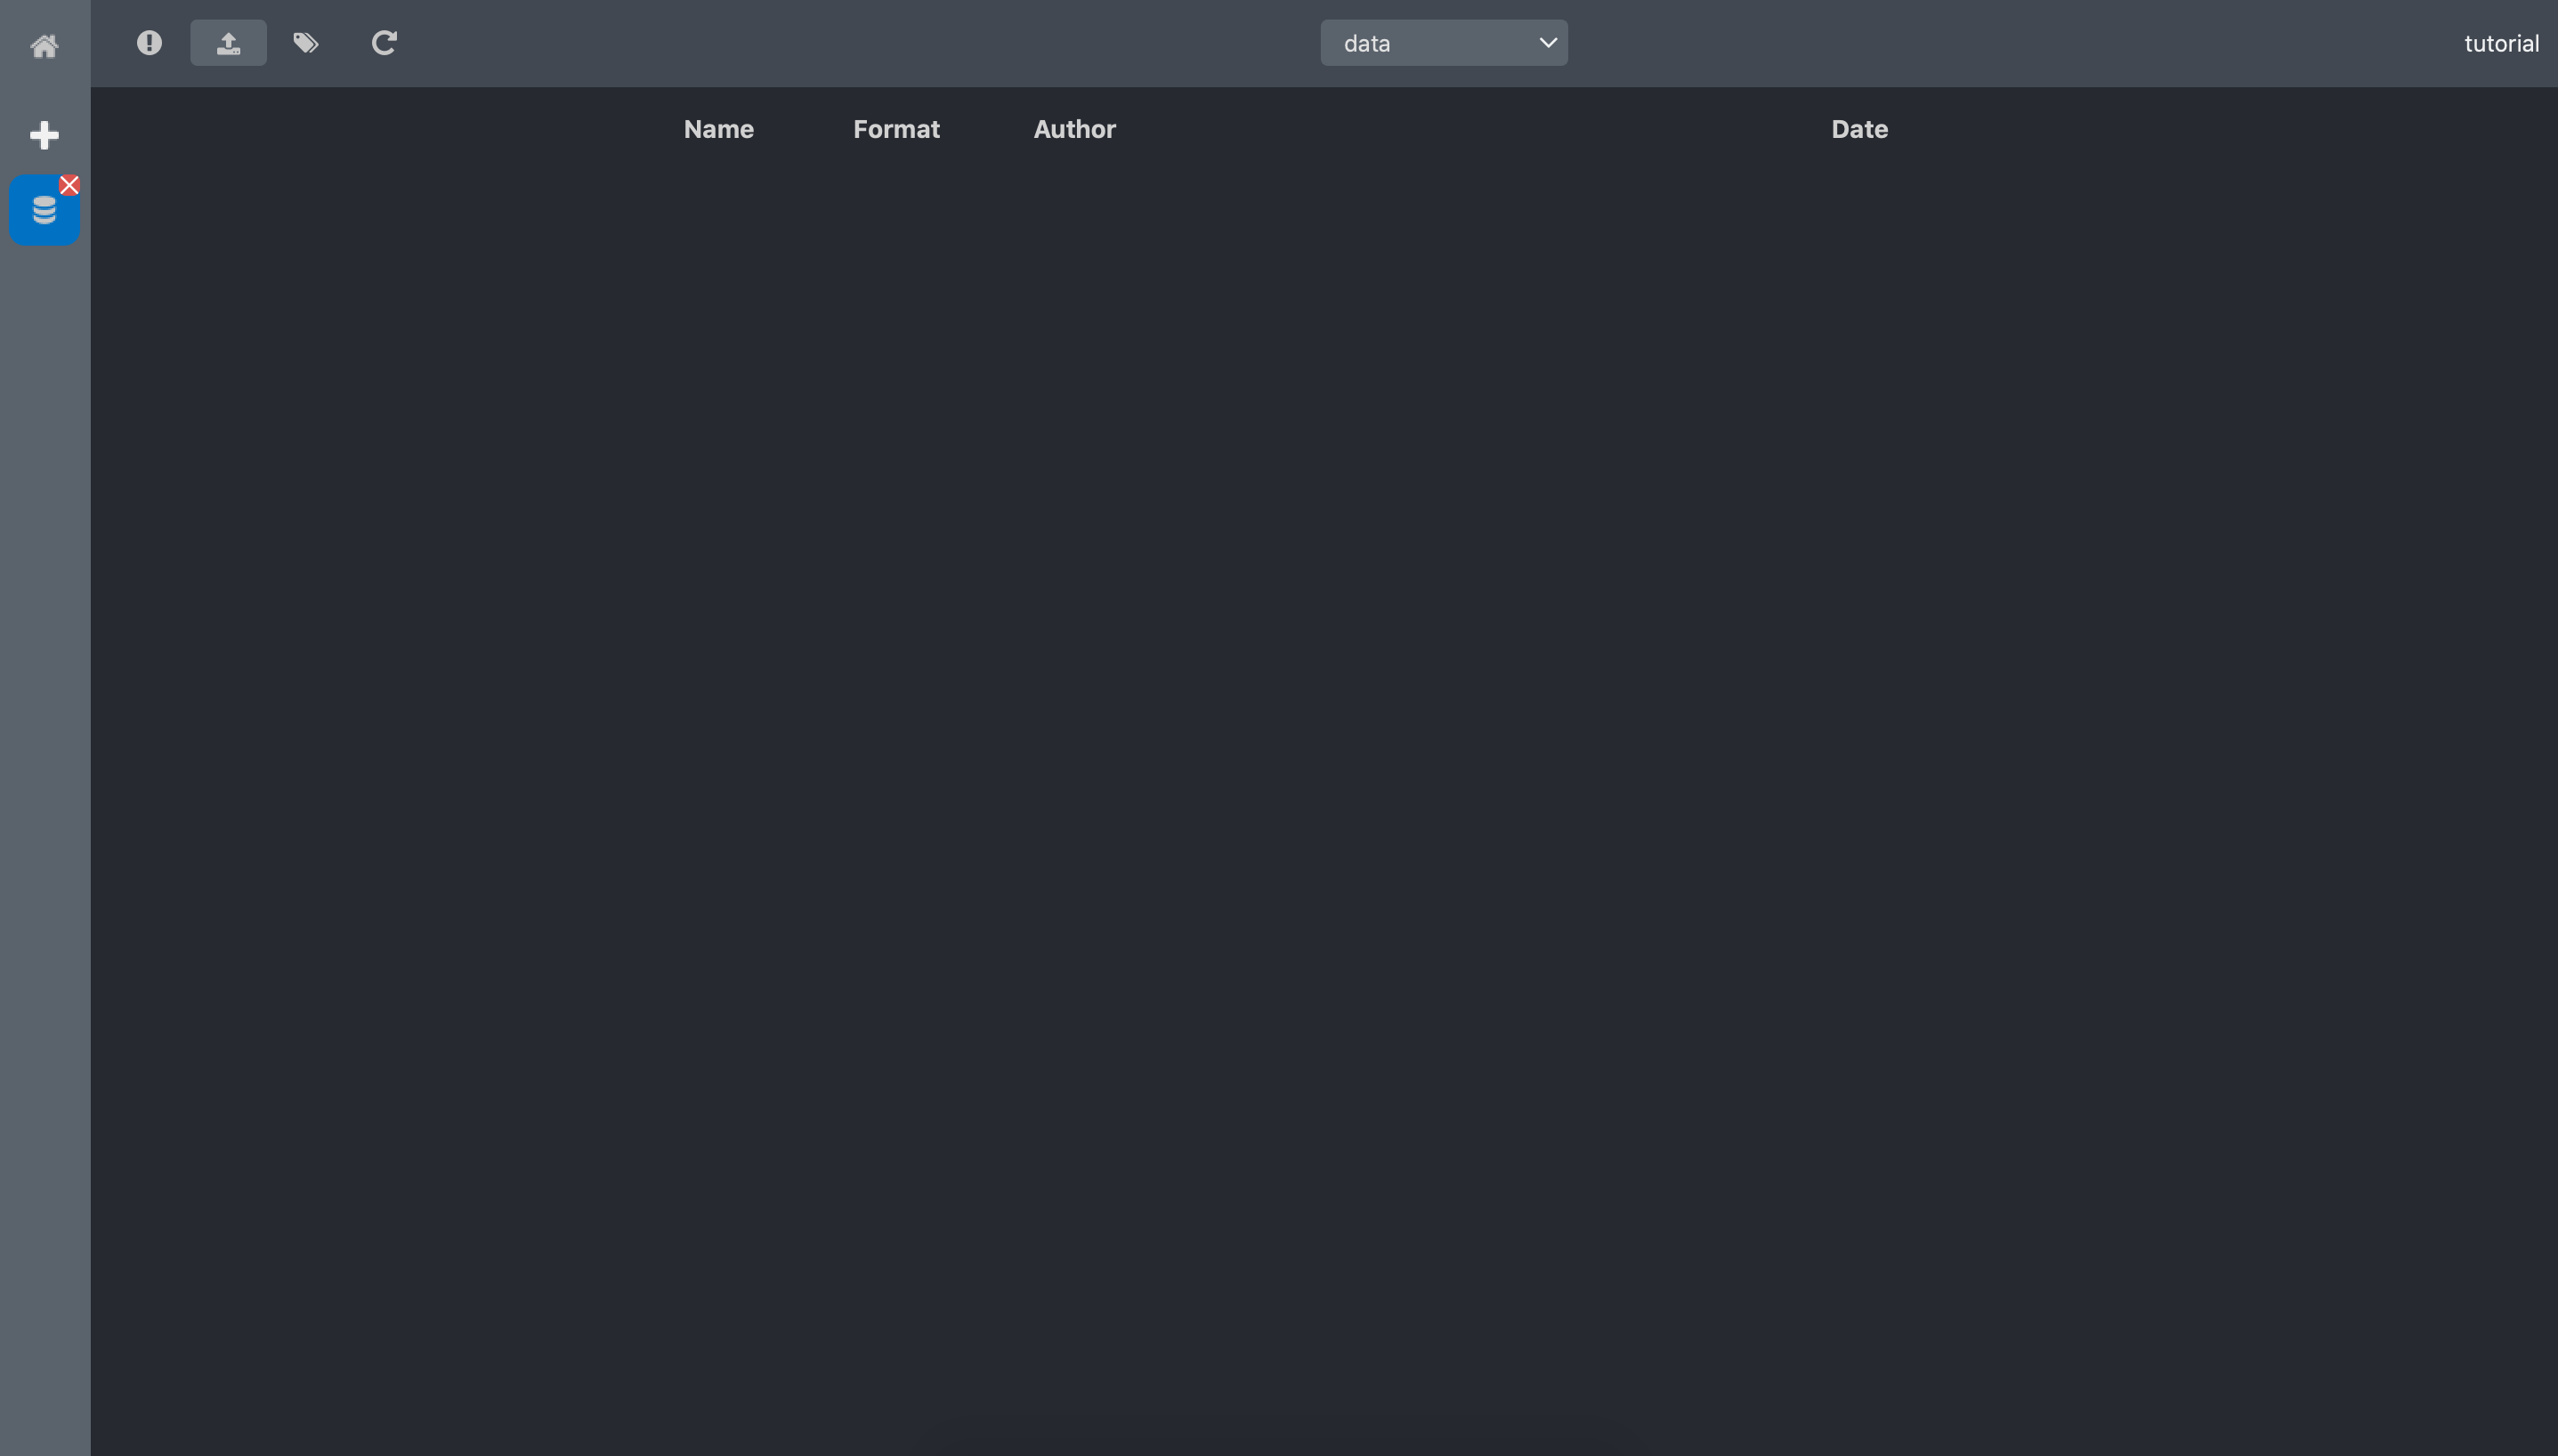
The experiment is created and the experiment editor screen appears. The experiment screen contains two areas:
1- The navigation bar allows to operate on the experiment metadata. Available tools are:
Information: the information tool button allows to edit the
Experimentmain metadata.Import data: the import data tool button shows a forms to import single data or a corpus of data from a directory.
Annotate data: the annotate data tool button shows a forms to annotate to raw data with key-value pairs
Refresh: the refresh tool button allows to reload the
Experimentmetadata.datasets: the dataset select box allows to select the dataset to display
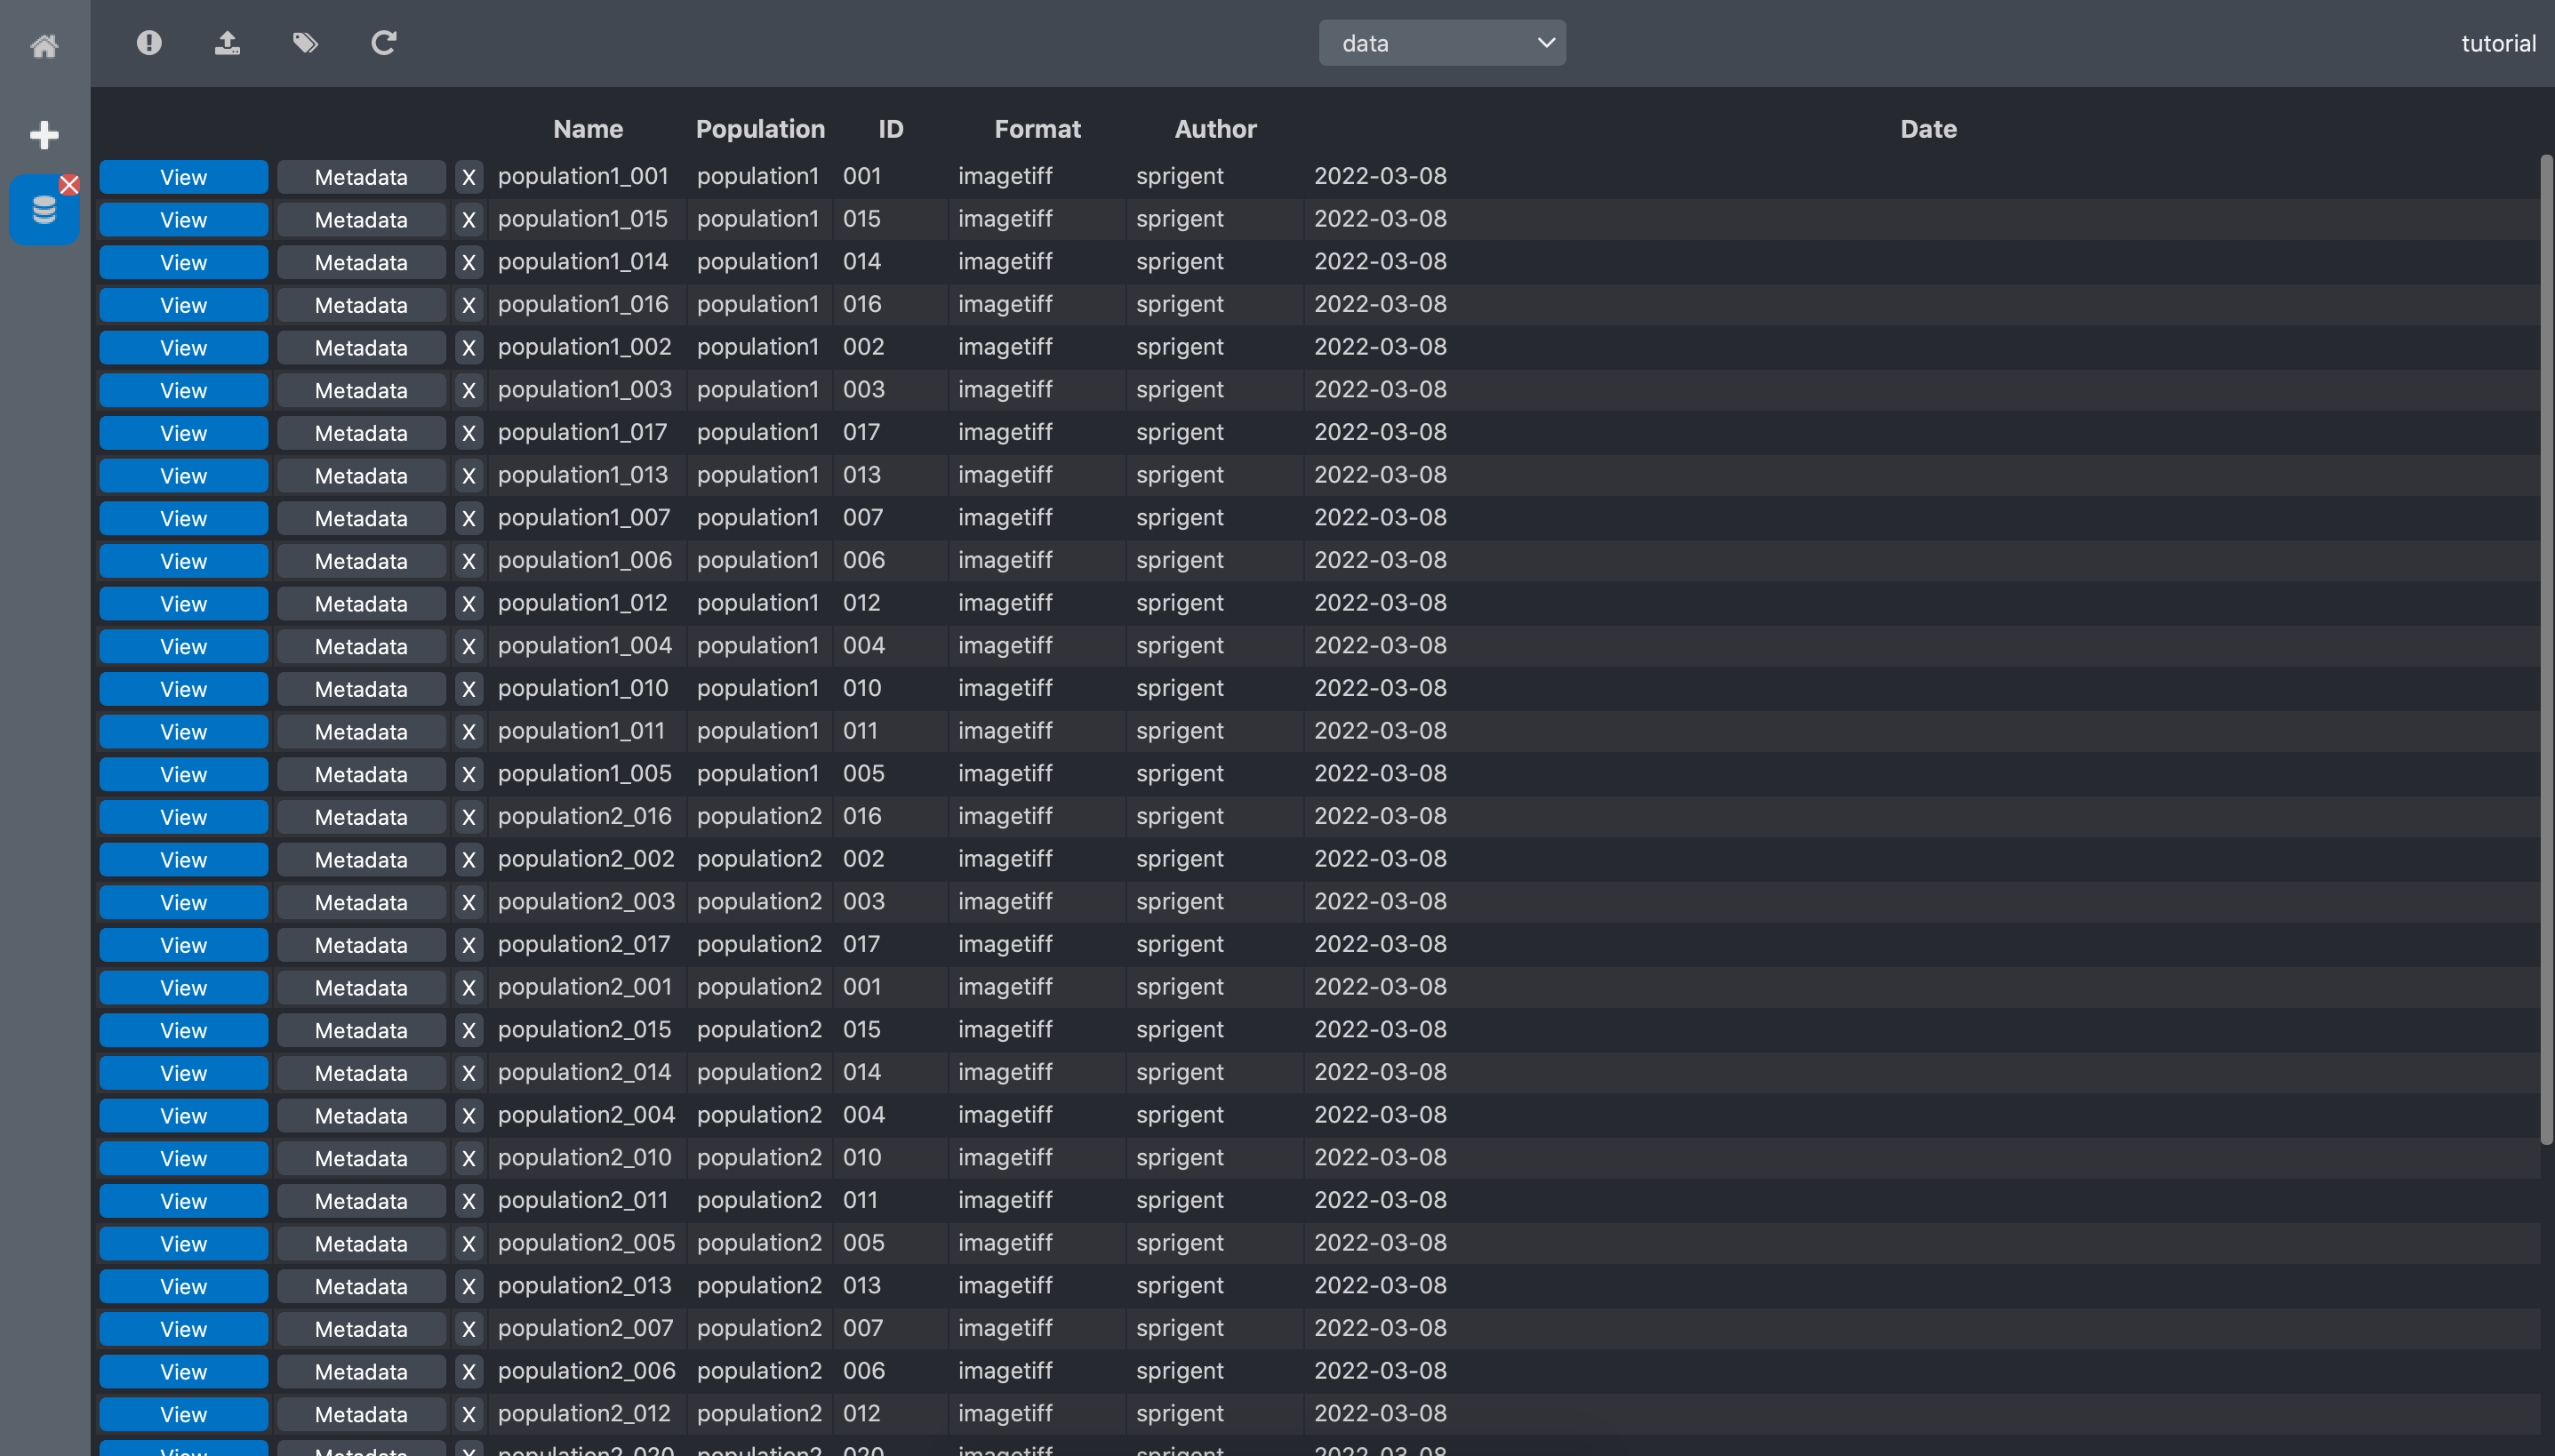
2- The central area contains the list of the data in the selected dataset
Let’s now import some data.
The tutorial dataset
To illustrate the Experiment management we will use a synthetic dataset available at https://github.com/bioimageit/bioimageit-notebooks/tree/main/synthetic_data/data The dataset is made of 40 synthetic images from 2 populations.
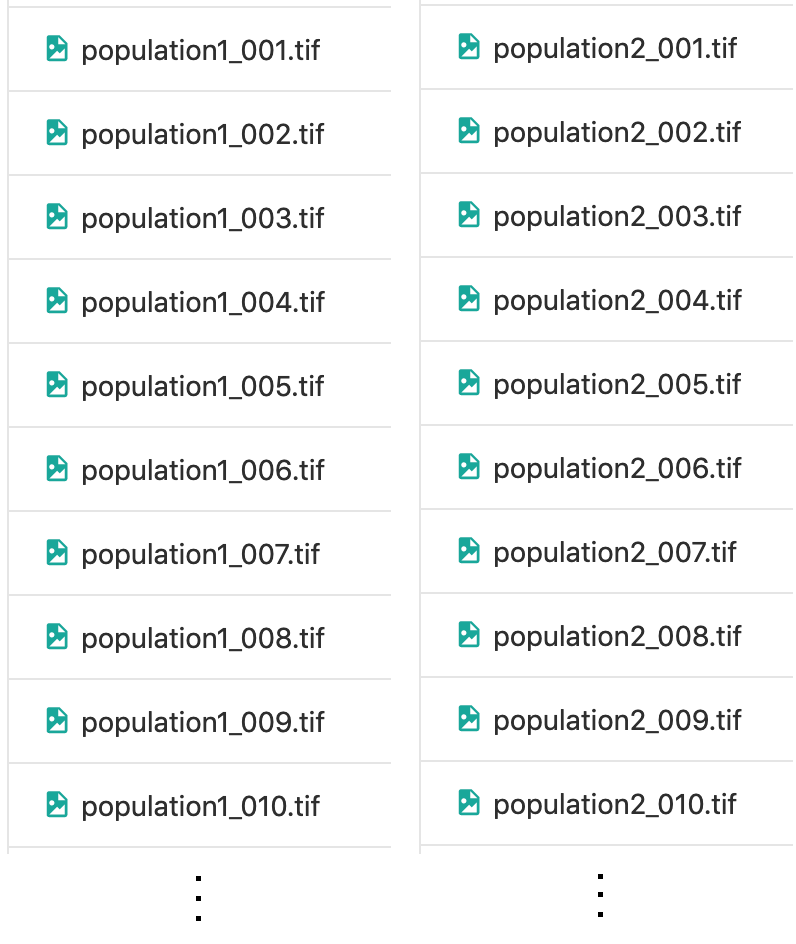
Data are spots with a lot of noise, and one population has more spots that the other. In this tutorial, we are going to import the dataset in the Experiment and annotate the raw data to identify the two populations.
Example image of population1:
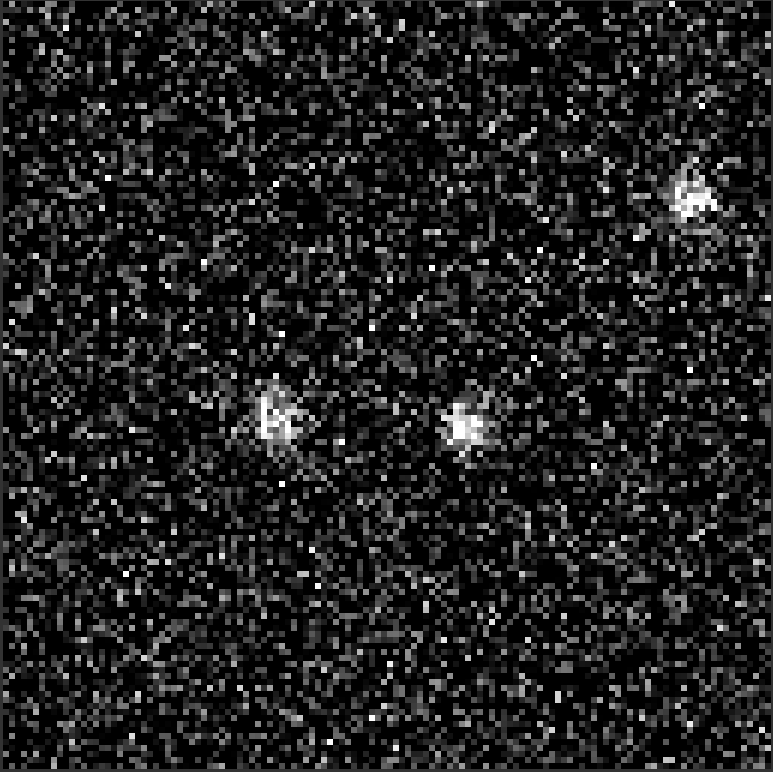
Example image of population2:

Import data
To import data, we click on the Import data tool button on the Experiment toolbar and select the
Multiple Data bar:
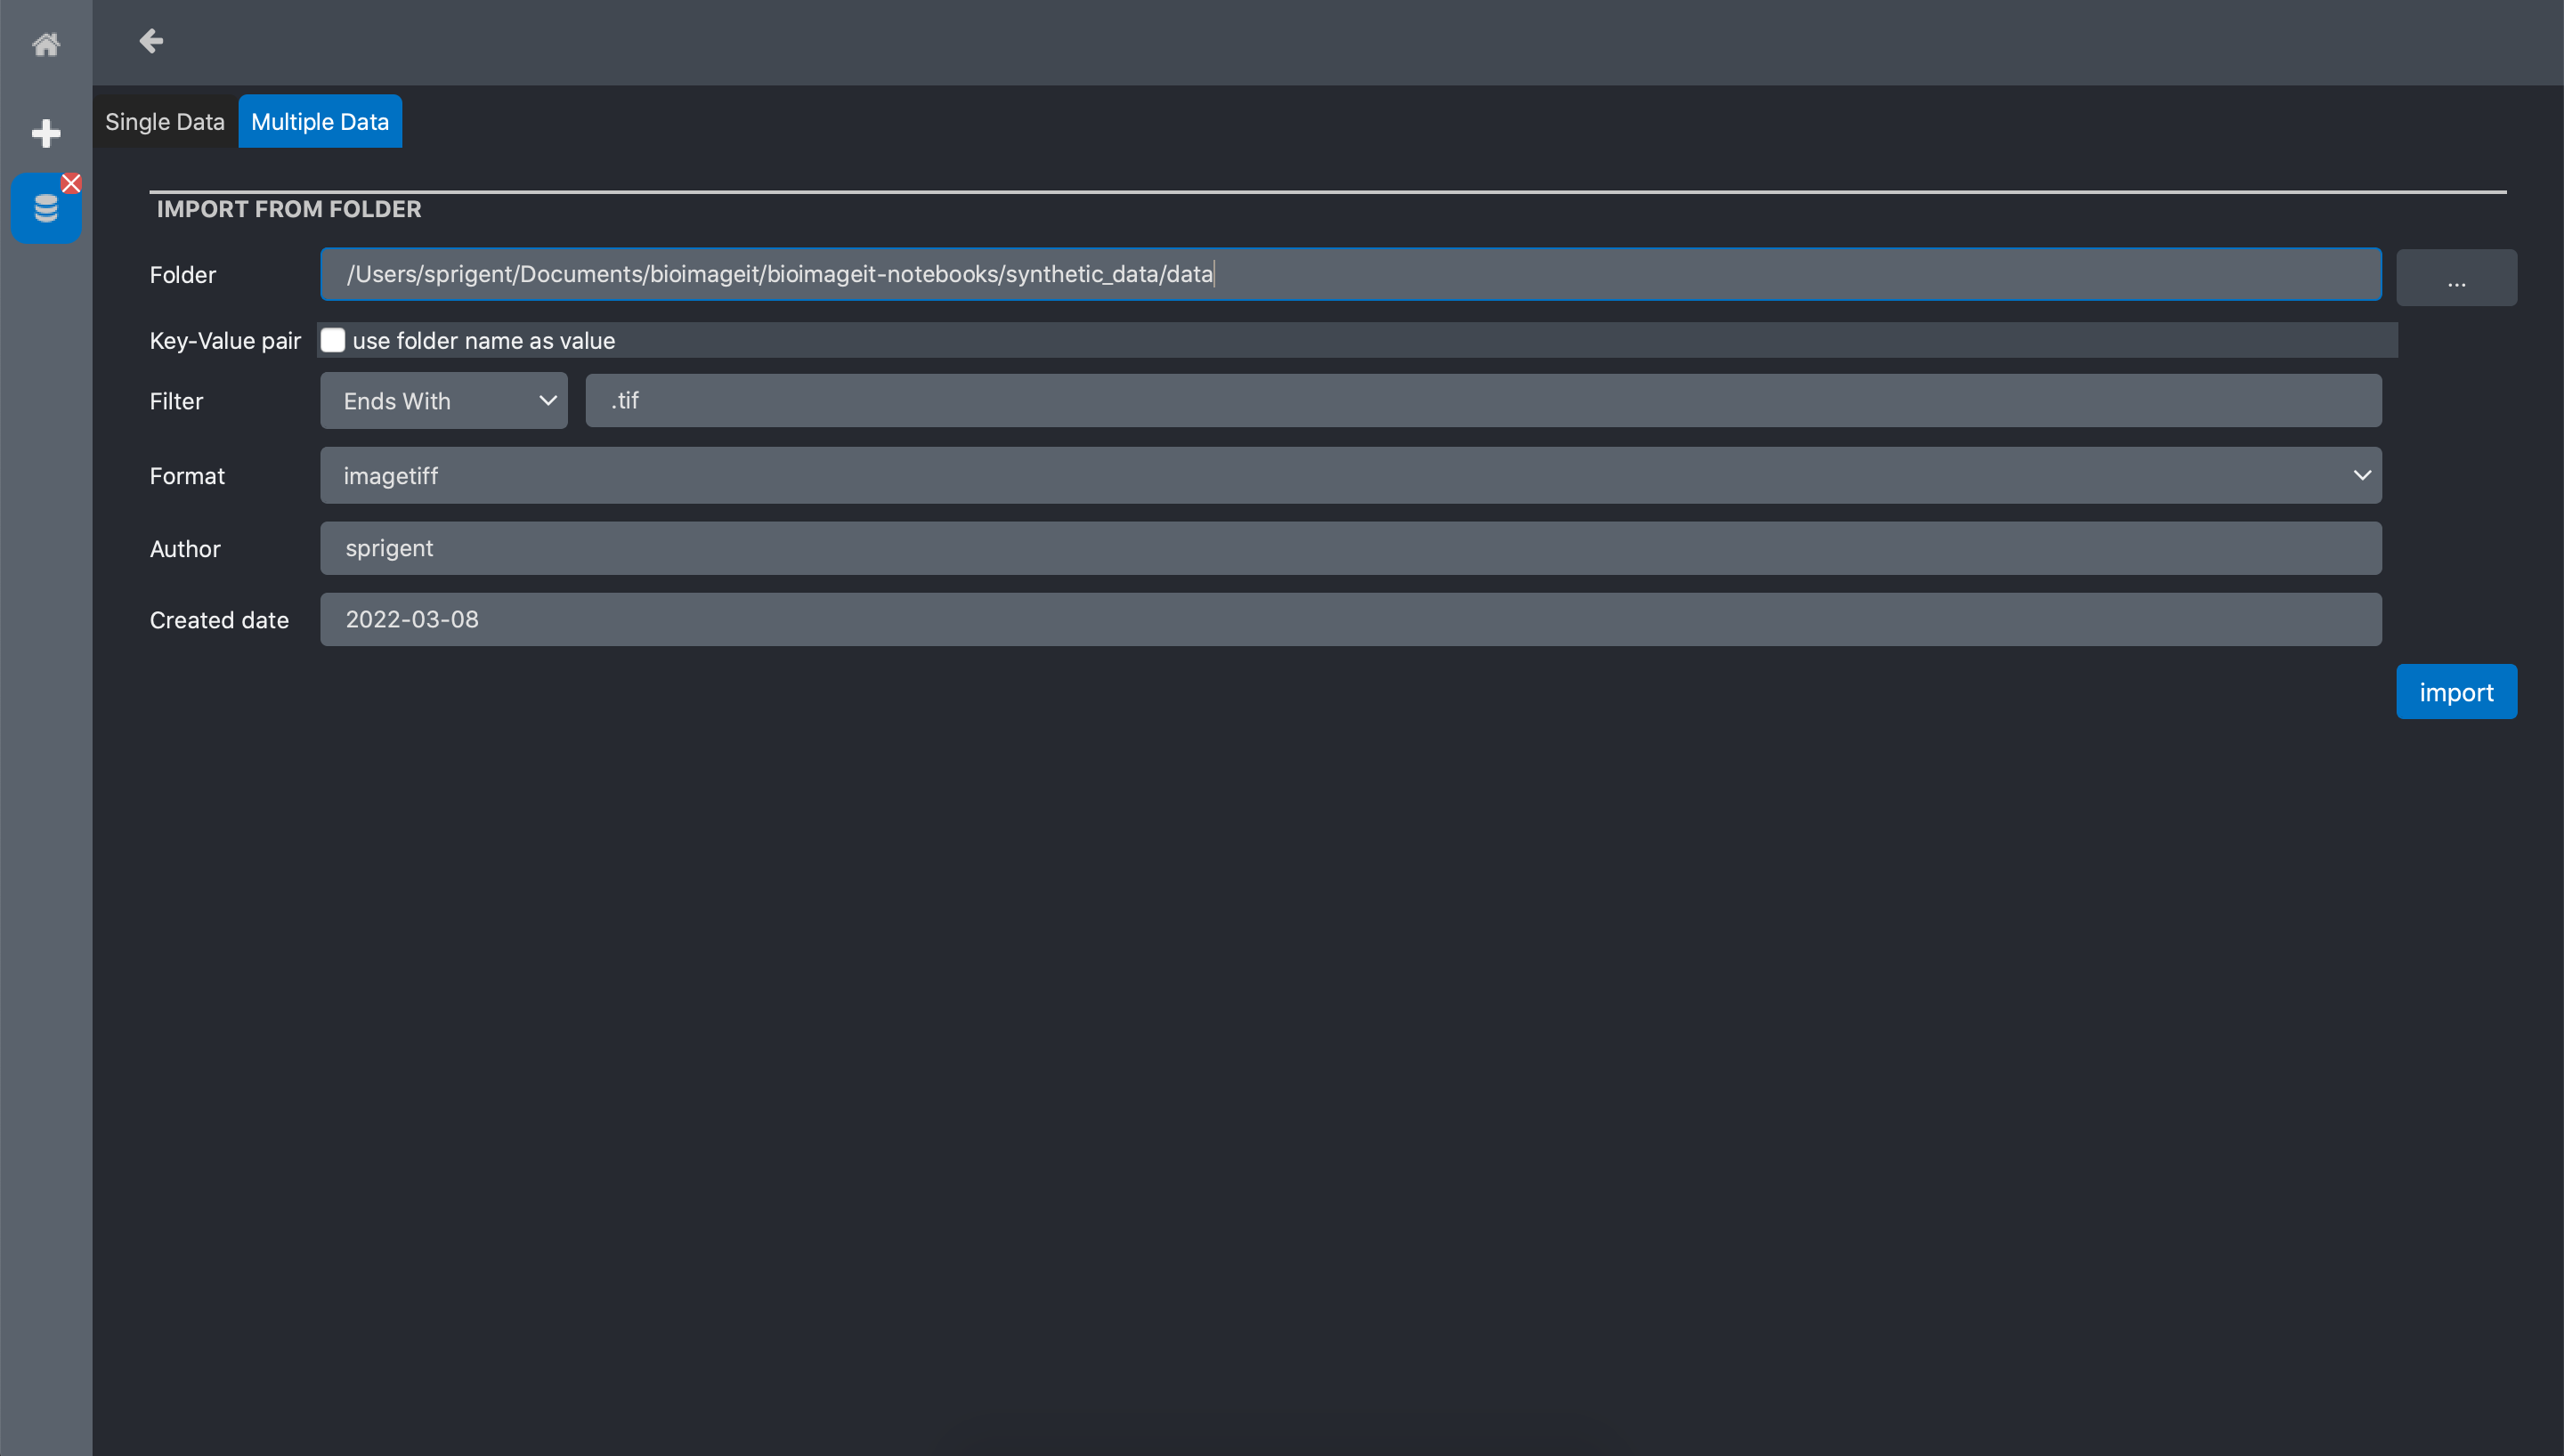
The popup window has two tabs. On to import a Single Data file, and one to import Multiple Data. In this tutorial, we have all the raw data in a folder. Thus we click the import Multiple Data tab. The form has the following inputs:
Folder: the directory where the data to import are stored
Key-value pairs: if checked, the name of the directory will be added as a data annotation
Filter: add a condition on the to import. In this example, we select all the file with a name ending by .tif
Format: a metadata information about the data format. Here we select ‘imagetiff’ since out images are TIFF files
Author: a metadata information about who created the data
Created date: a metadata information about when the data have been created.
Click import.
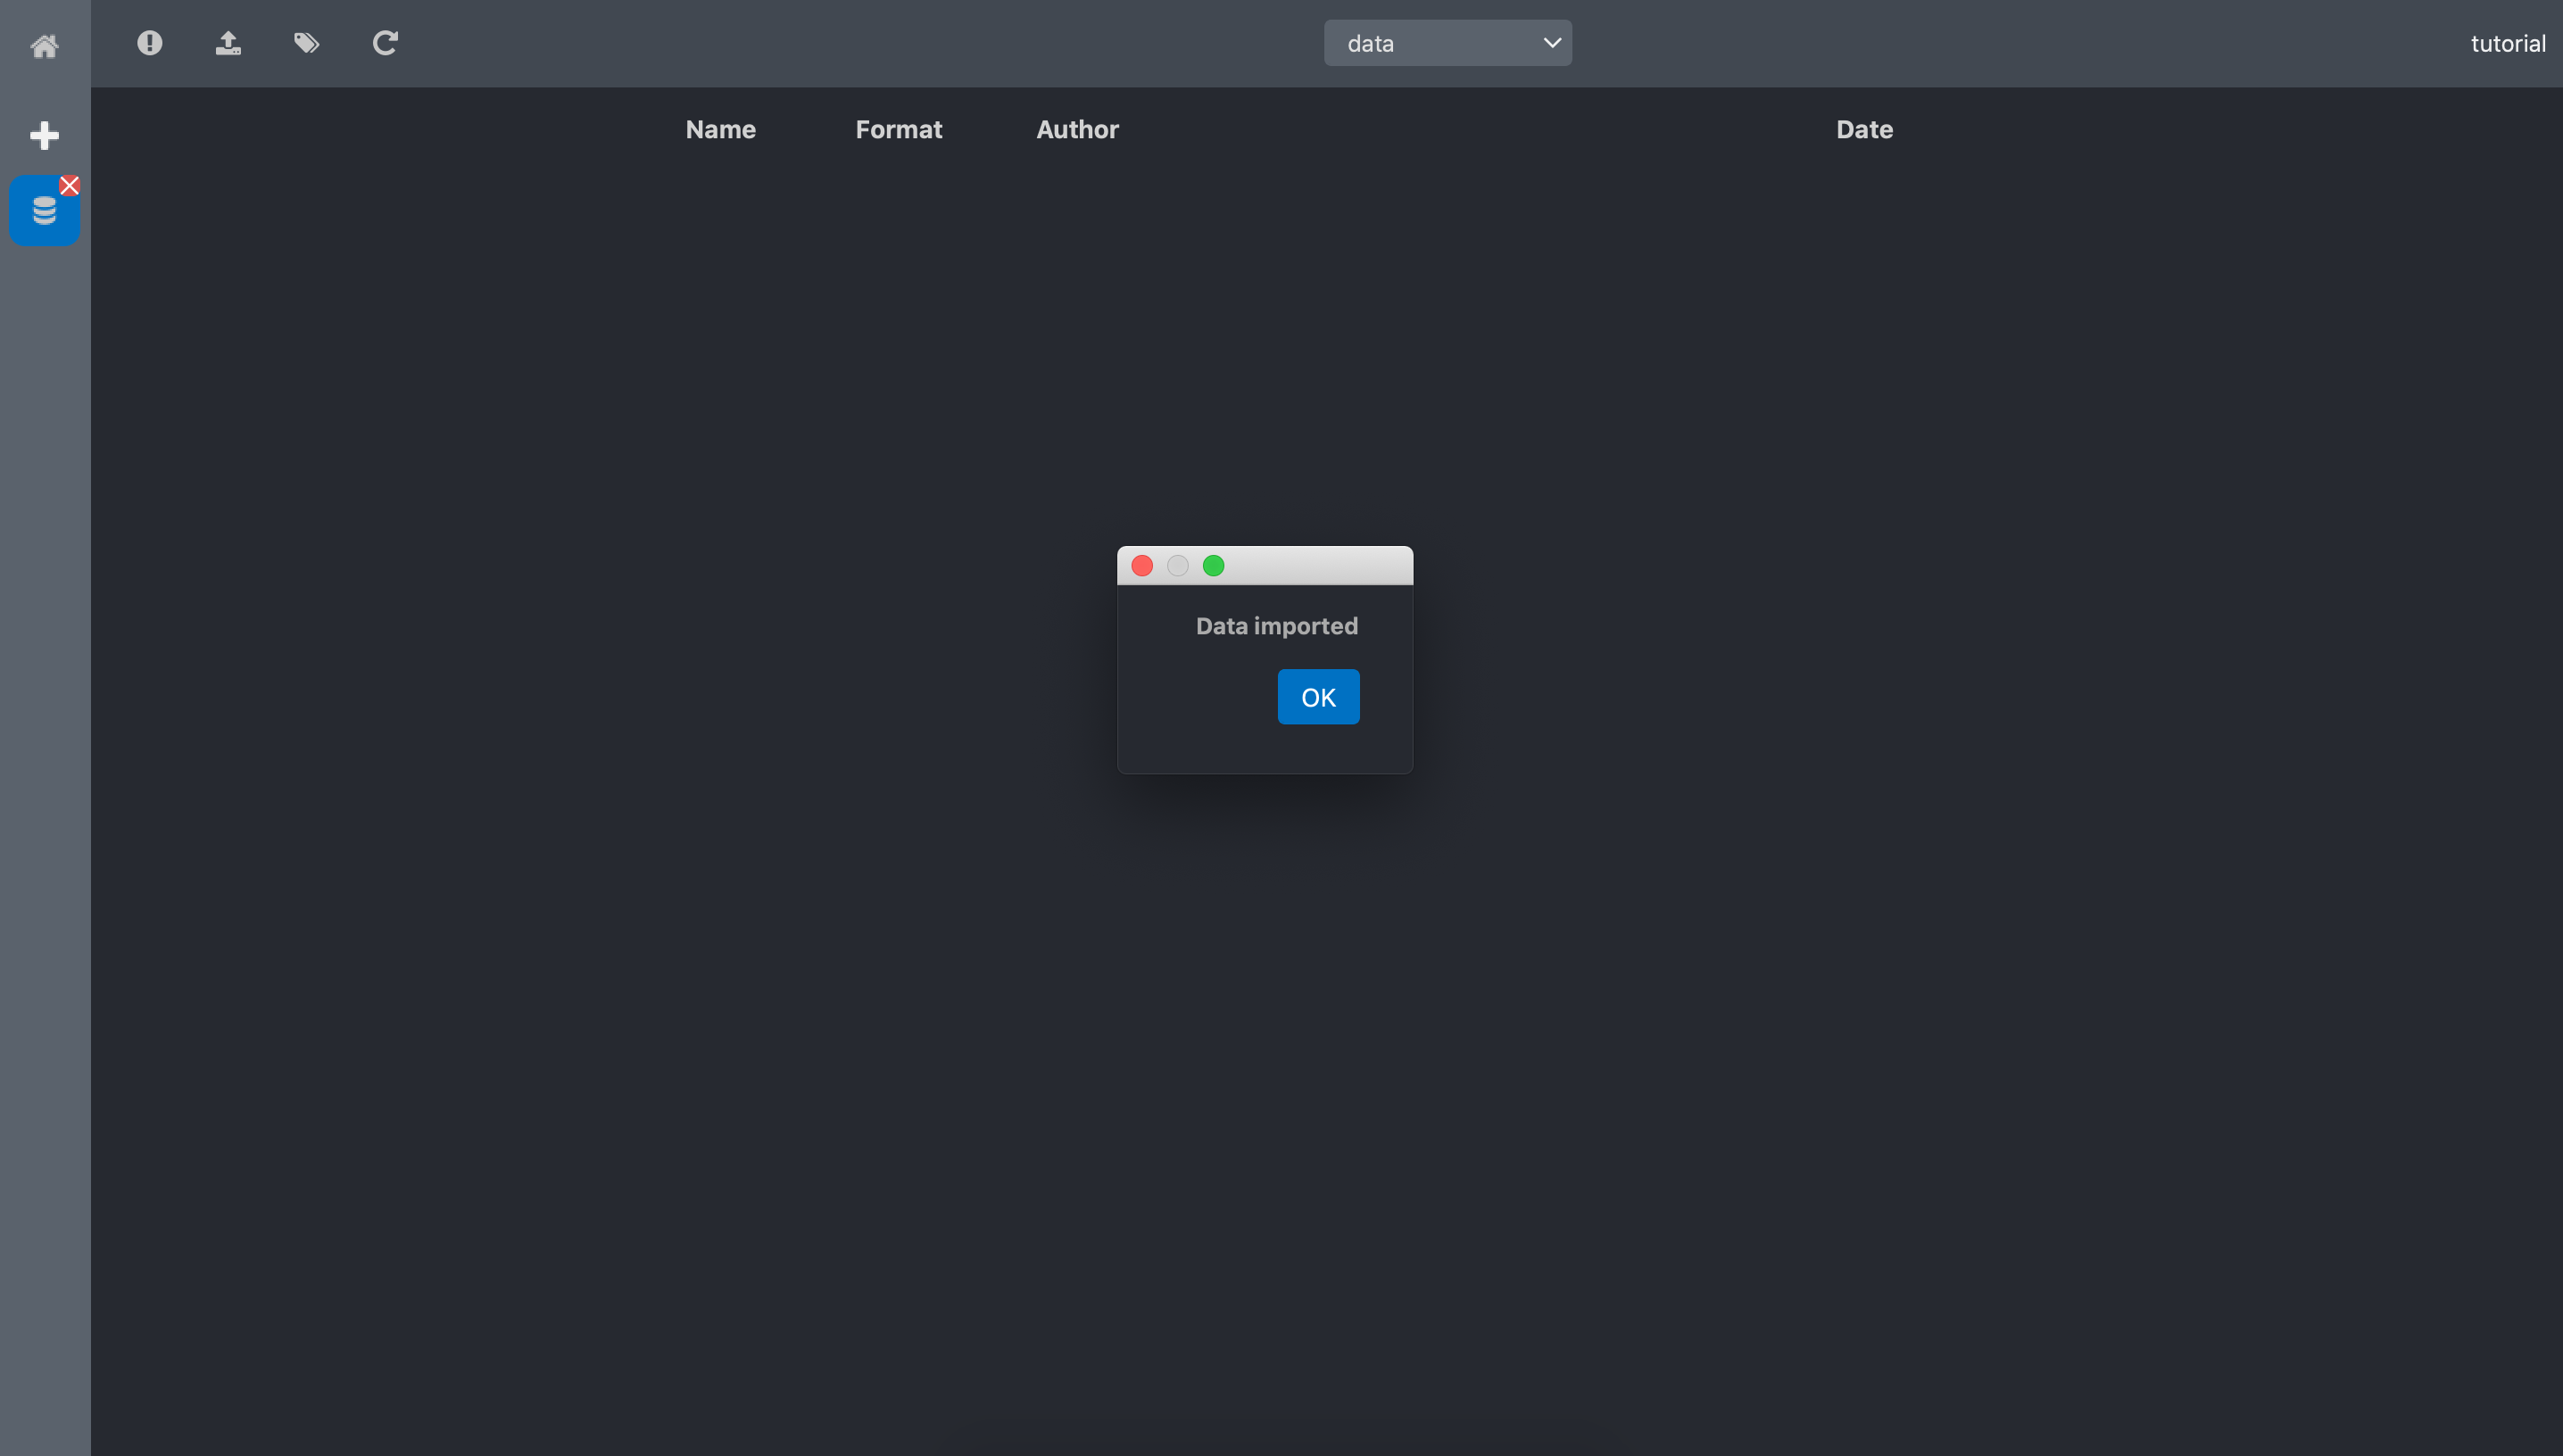
When the data are imported a popup window inform that the import is done.
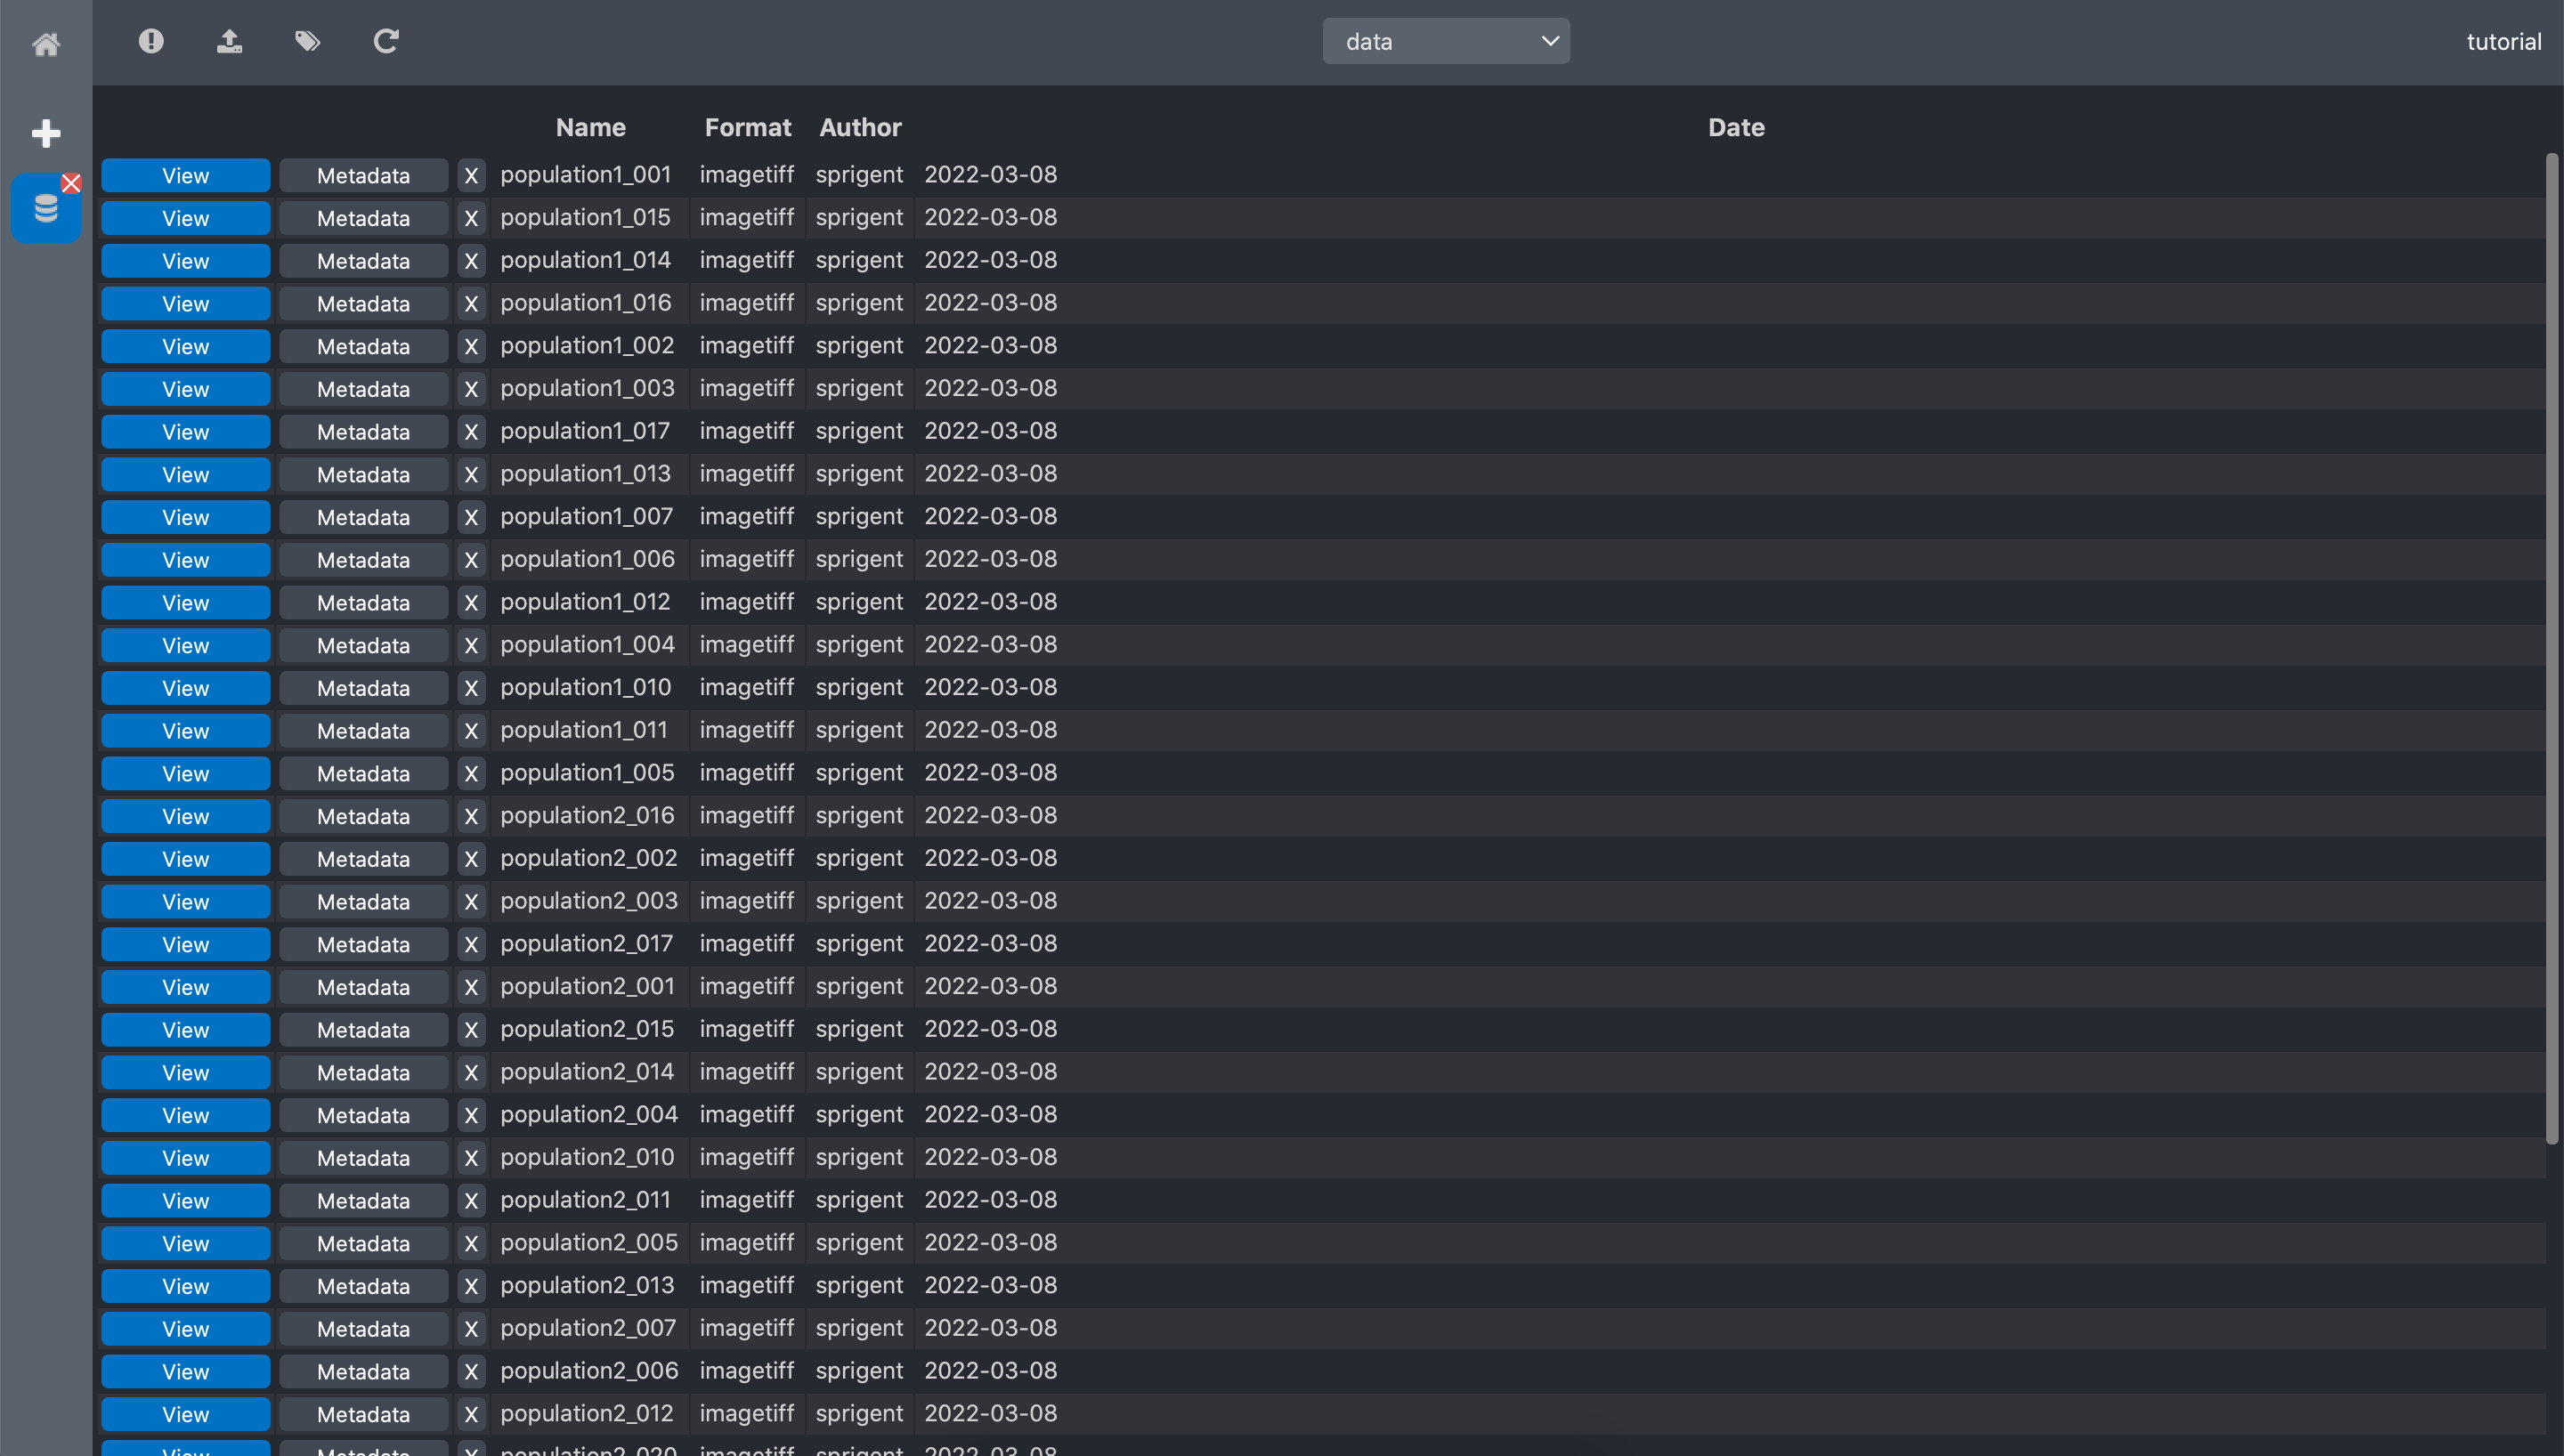
Click ok. The dataset data automatically updates and now we have the list of the imported
data.
Annotate the data
As we saw at the beginning of this tutorial, the imported data are from 2 populations. We now want to annotate the data individually to identify them.
Click on the Annotate data tool button.
The tag data screen has 3 tabs:
Keys: is a form to manually declare new keys to the
Experiment. This is useful only when we want to manually annotate all the dataAnnotate using separator: contains a tool to automatically extract strings from the
RawDatafile names using separator strings.Annotate using names: contains a tool to automatically extract keywords from the
RawDataby searching specific words in the file names.
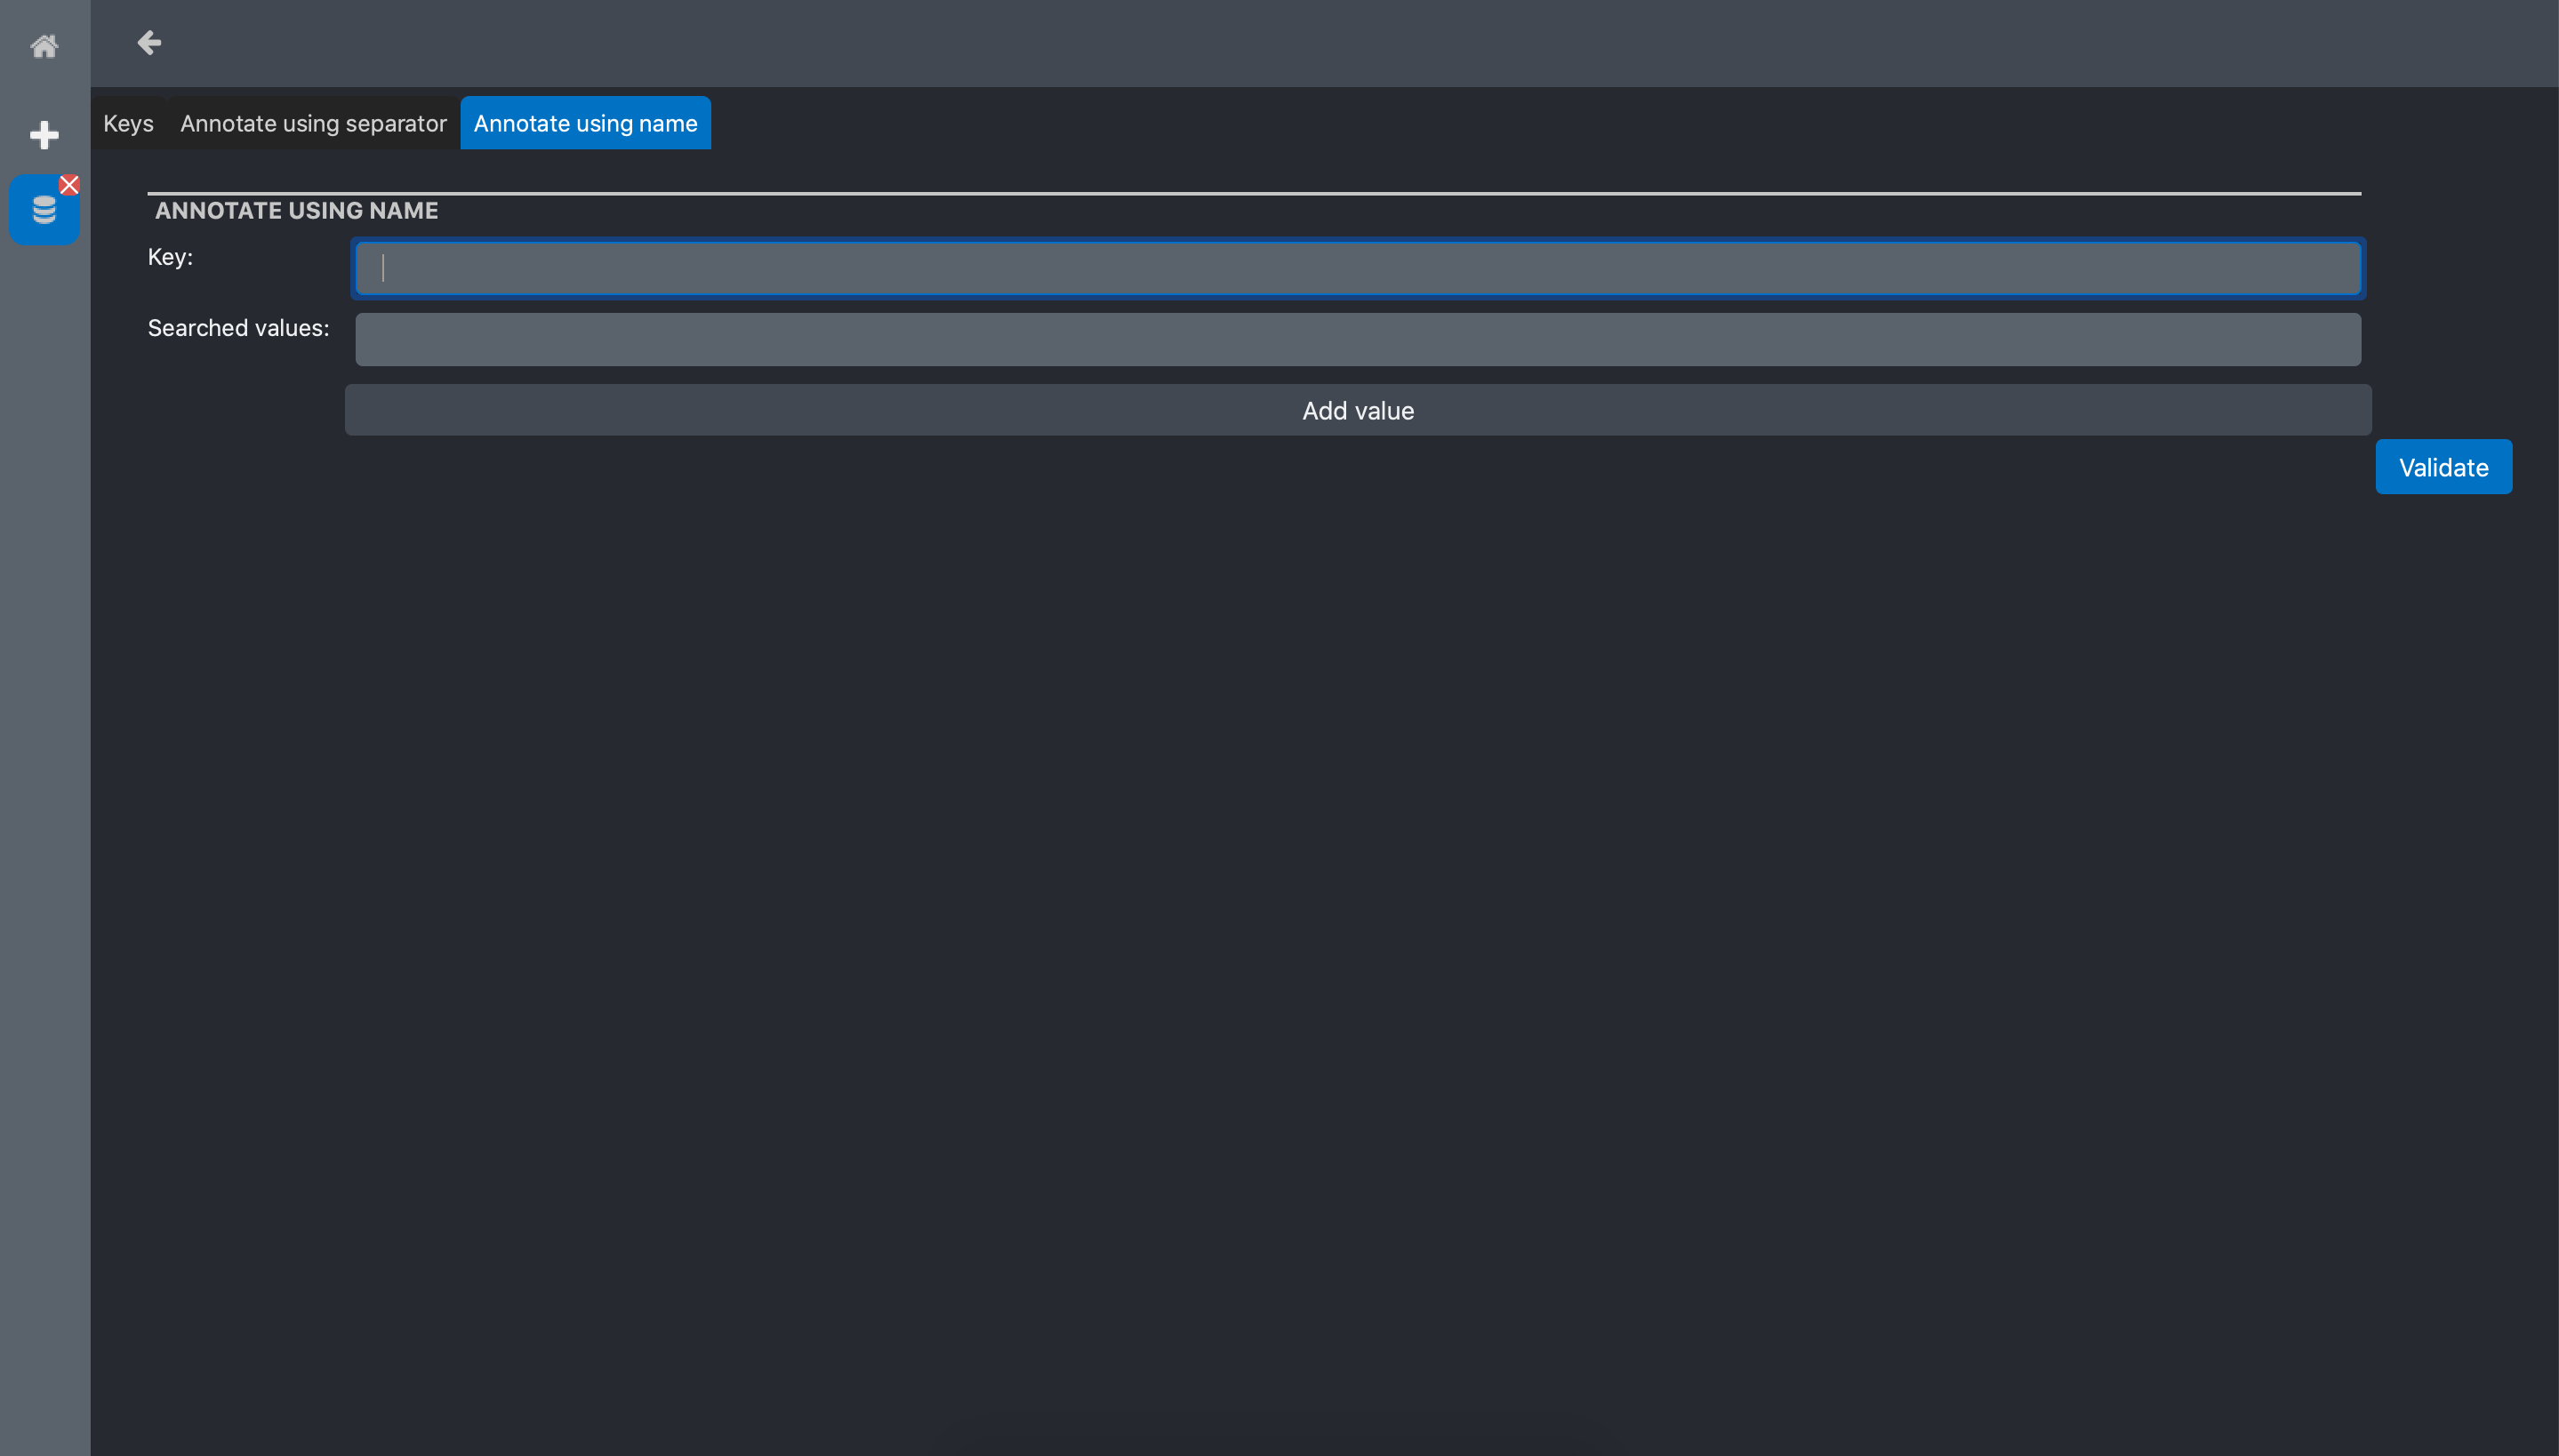
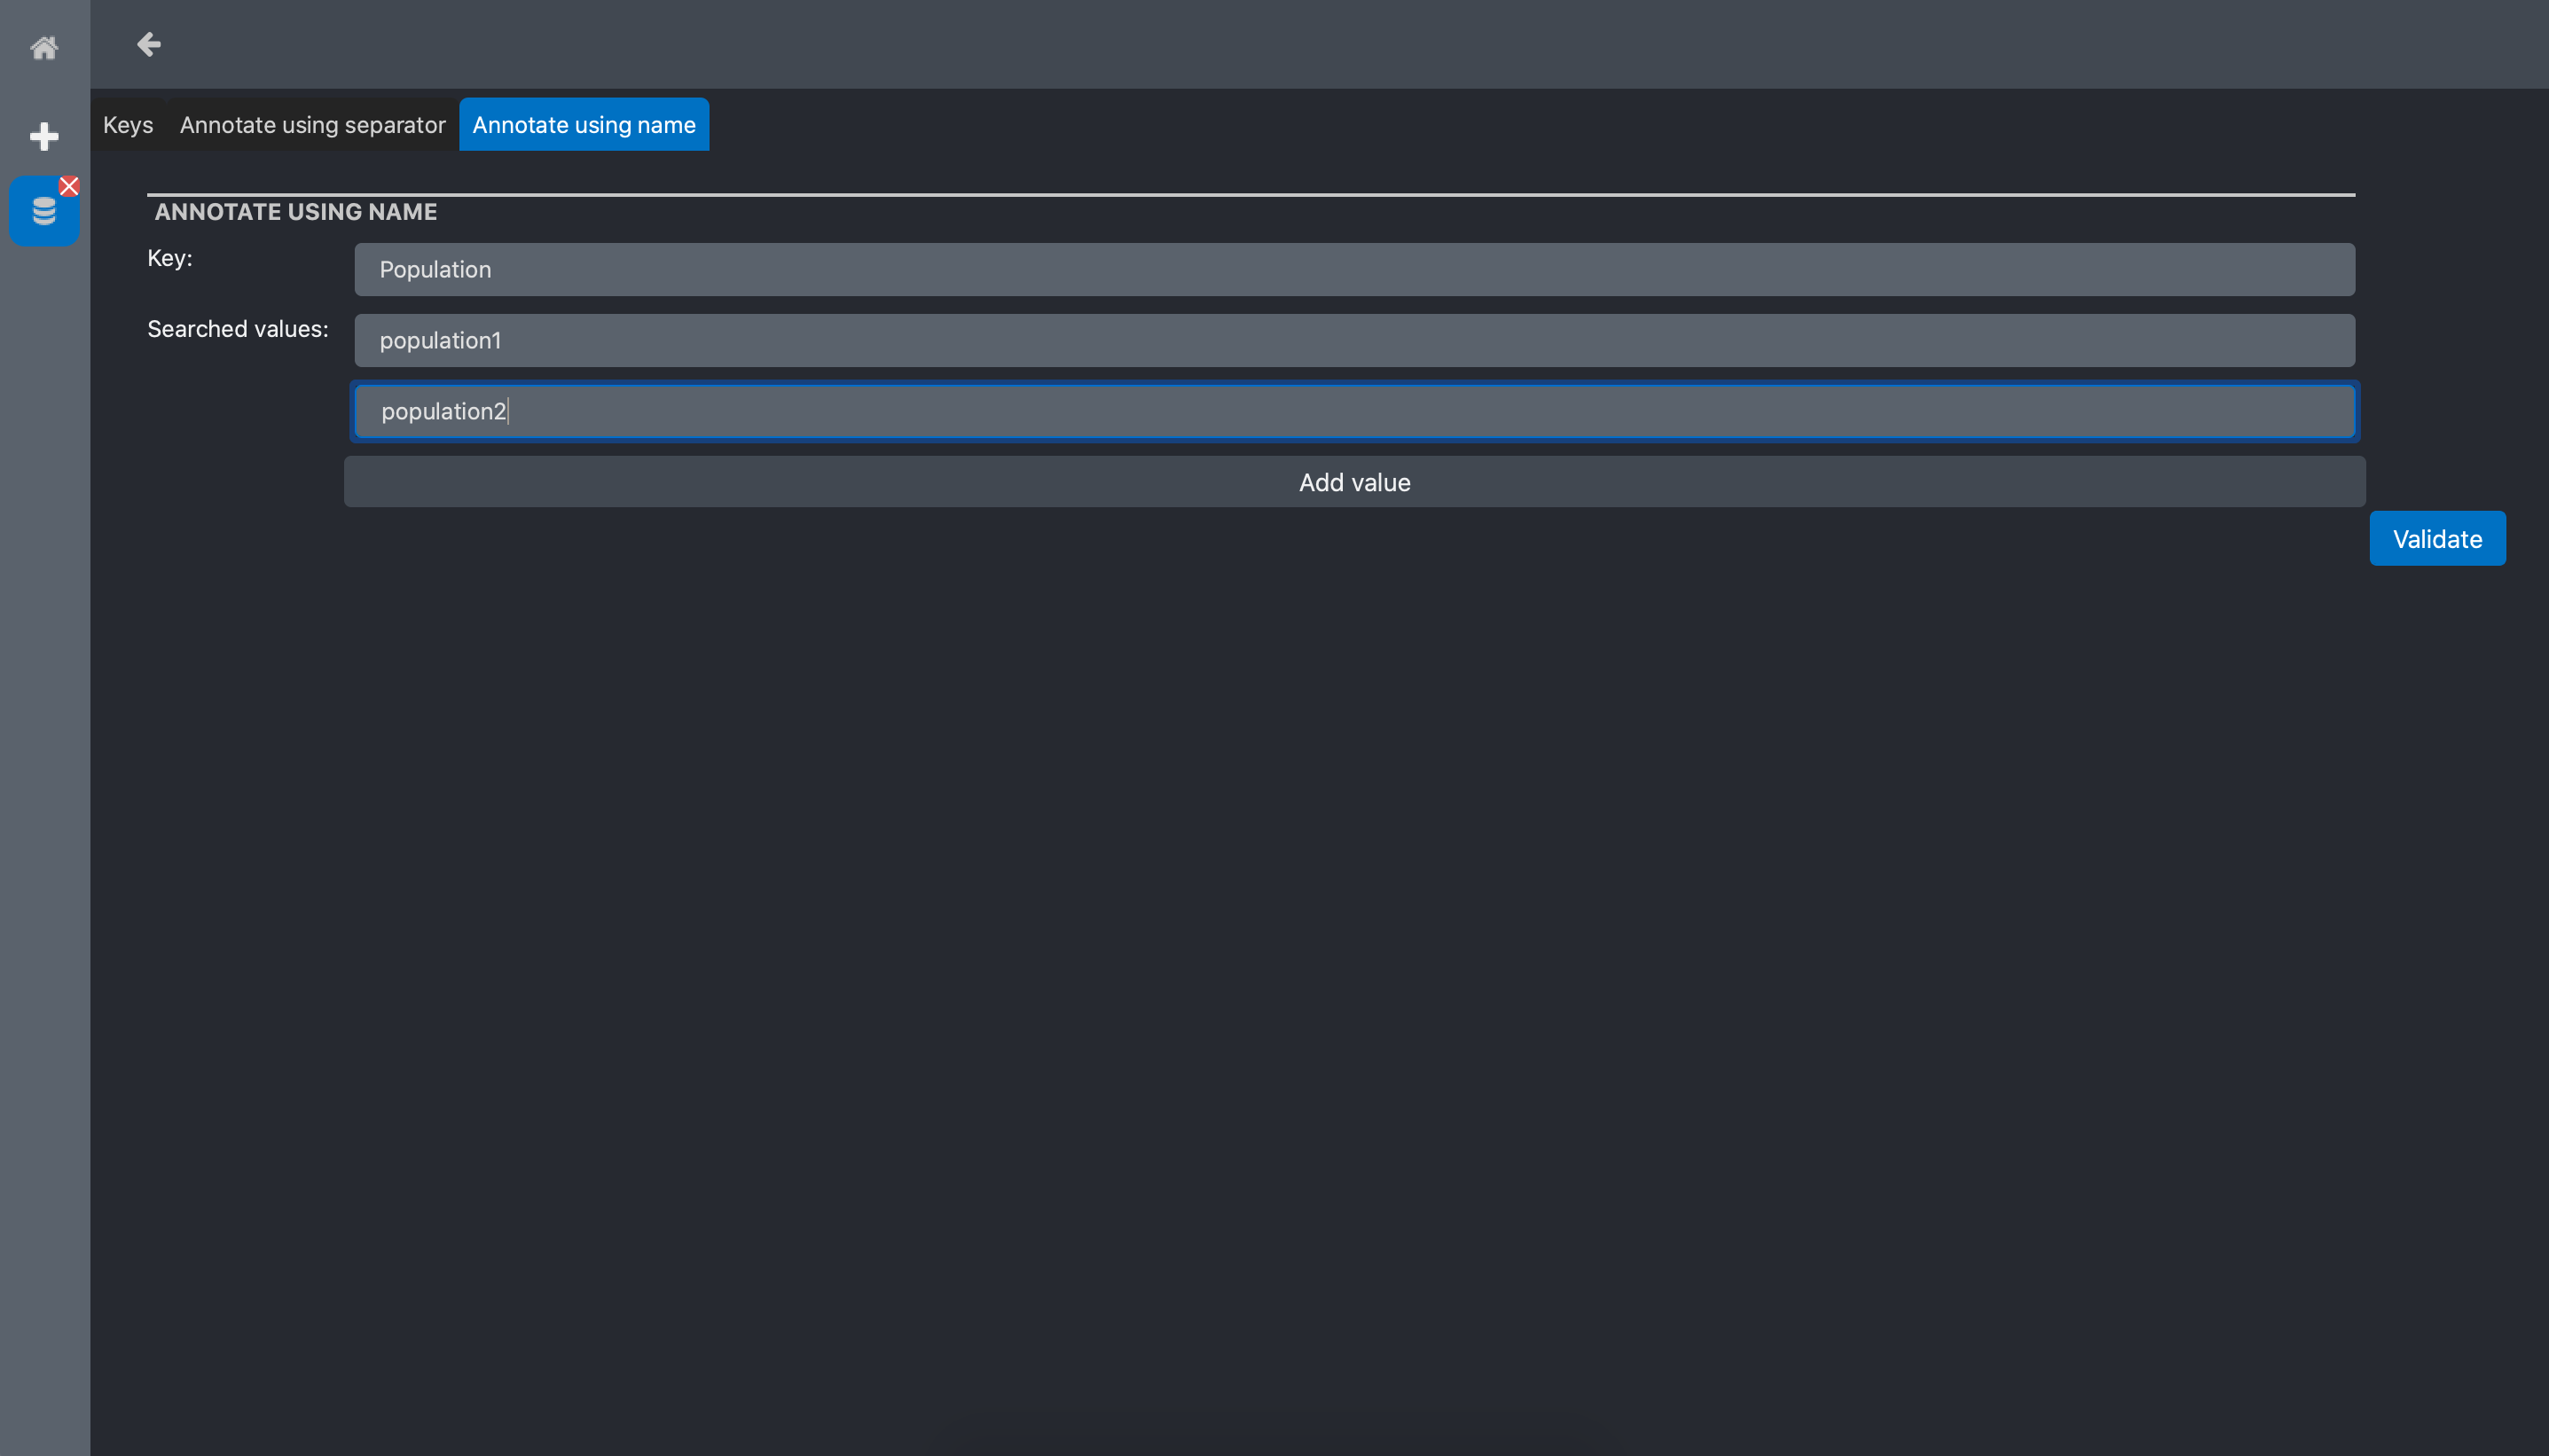
In the sample data we use for this tutorial, the file names contains the words population1 and population2. Thus, we will use the Annotate using names tool. The Annotate using names tool form has 2 inputs:
Key: the name we want to give to the tag. In our example, we use Population
Searched values: the words we want to extract from the file names. In out example, we want to extract population1 and population2
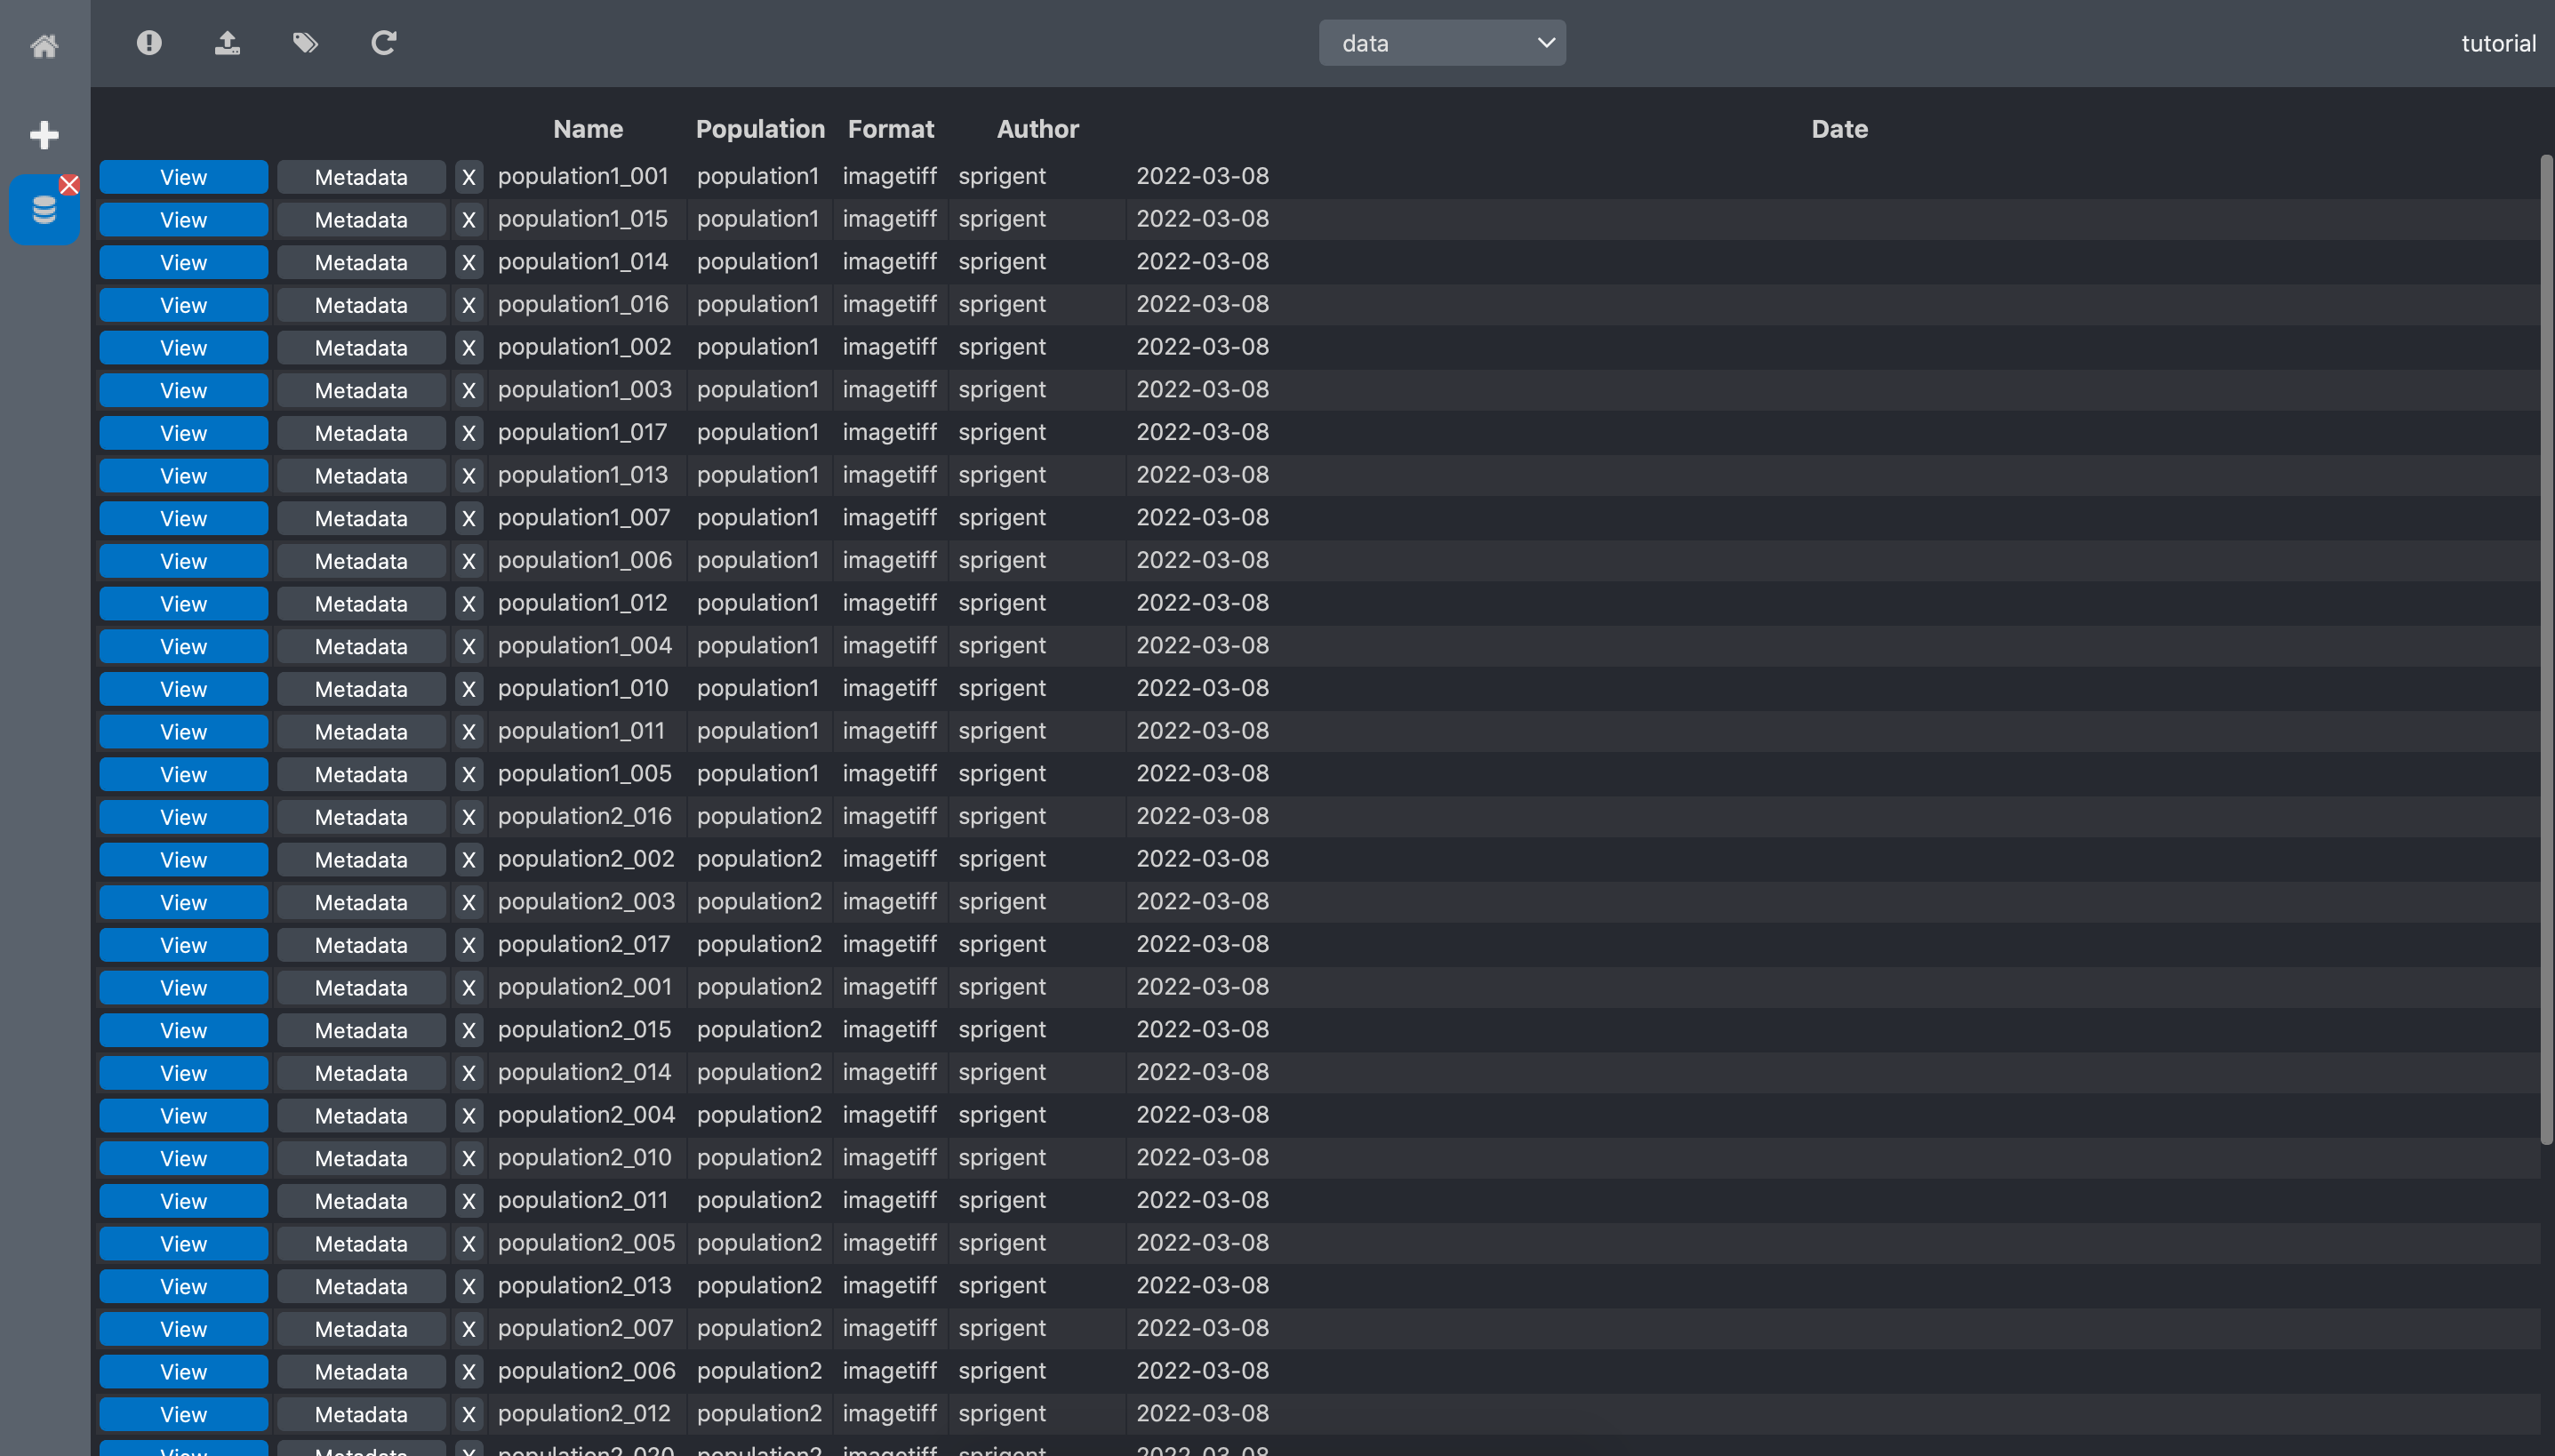
click Validate, and a new column with the extracted keywords is now visible in the data
dataset list view:
In our sample data, the file names also contains a number located between two _. We propose now to extract this number as an annotation for each data.
Click on the Annotate data tool button and select the tab Annotate using separator.
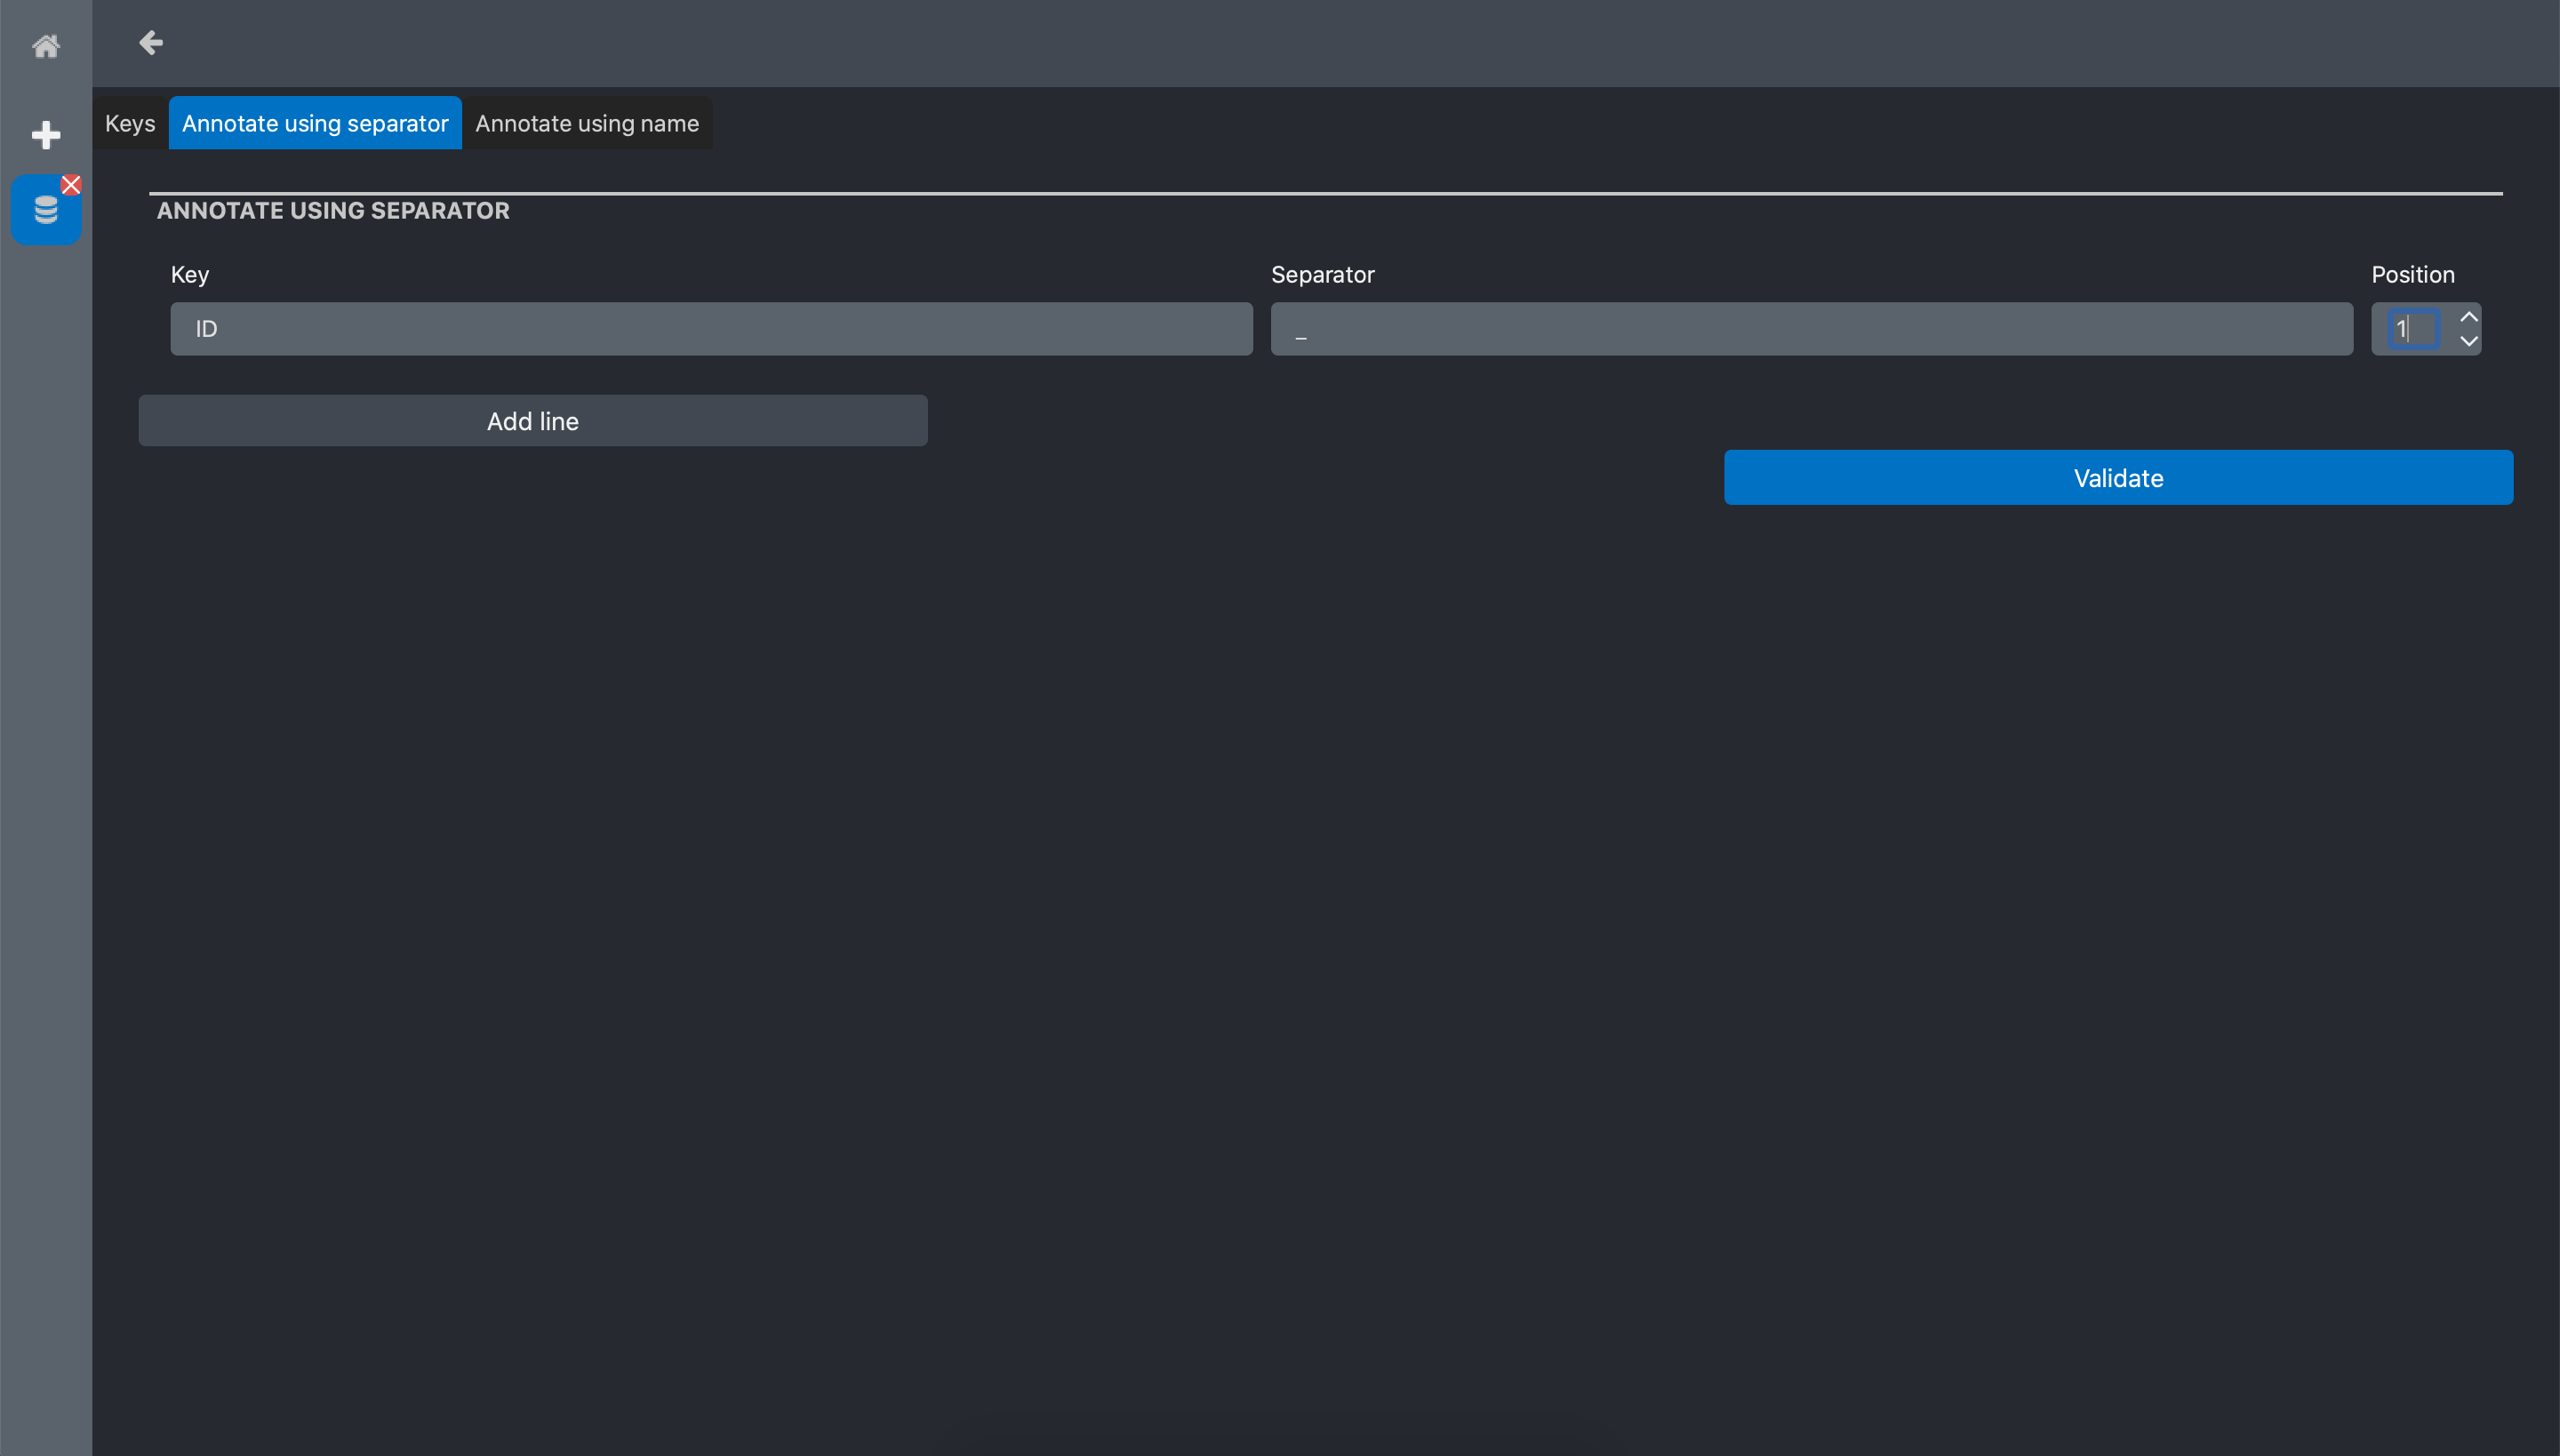
We fill the form as follow:
Key: the name we want to give the annotation key. Here we chose ID
Separator: the chars that is used as separator in the filename. In our example it is _
Position: The position of the word we want extract with respect to Separator. In our example we set 1 because we want the word that is just after the first _ in the file name.
Click Validate, and a new column with the extracted tag is now visible in the RawDataSet data list view:
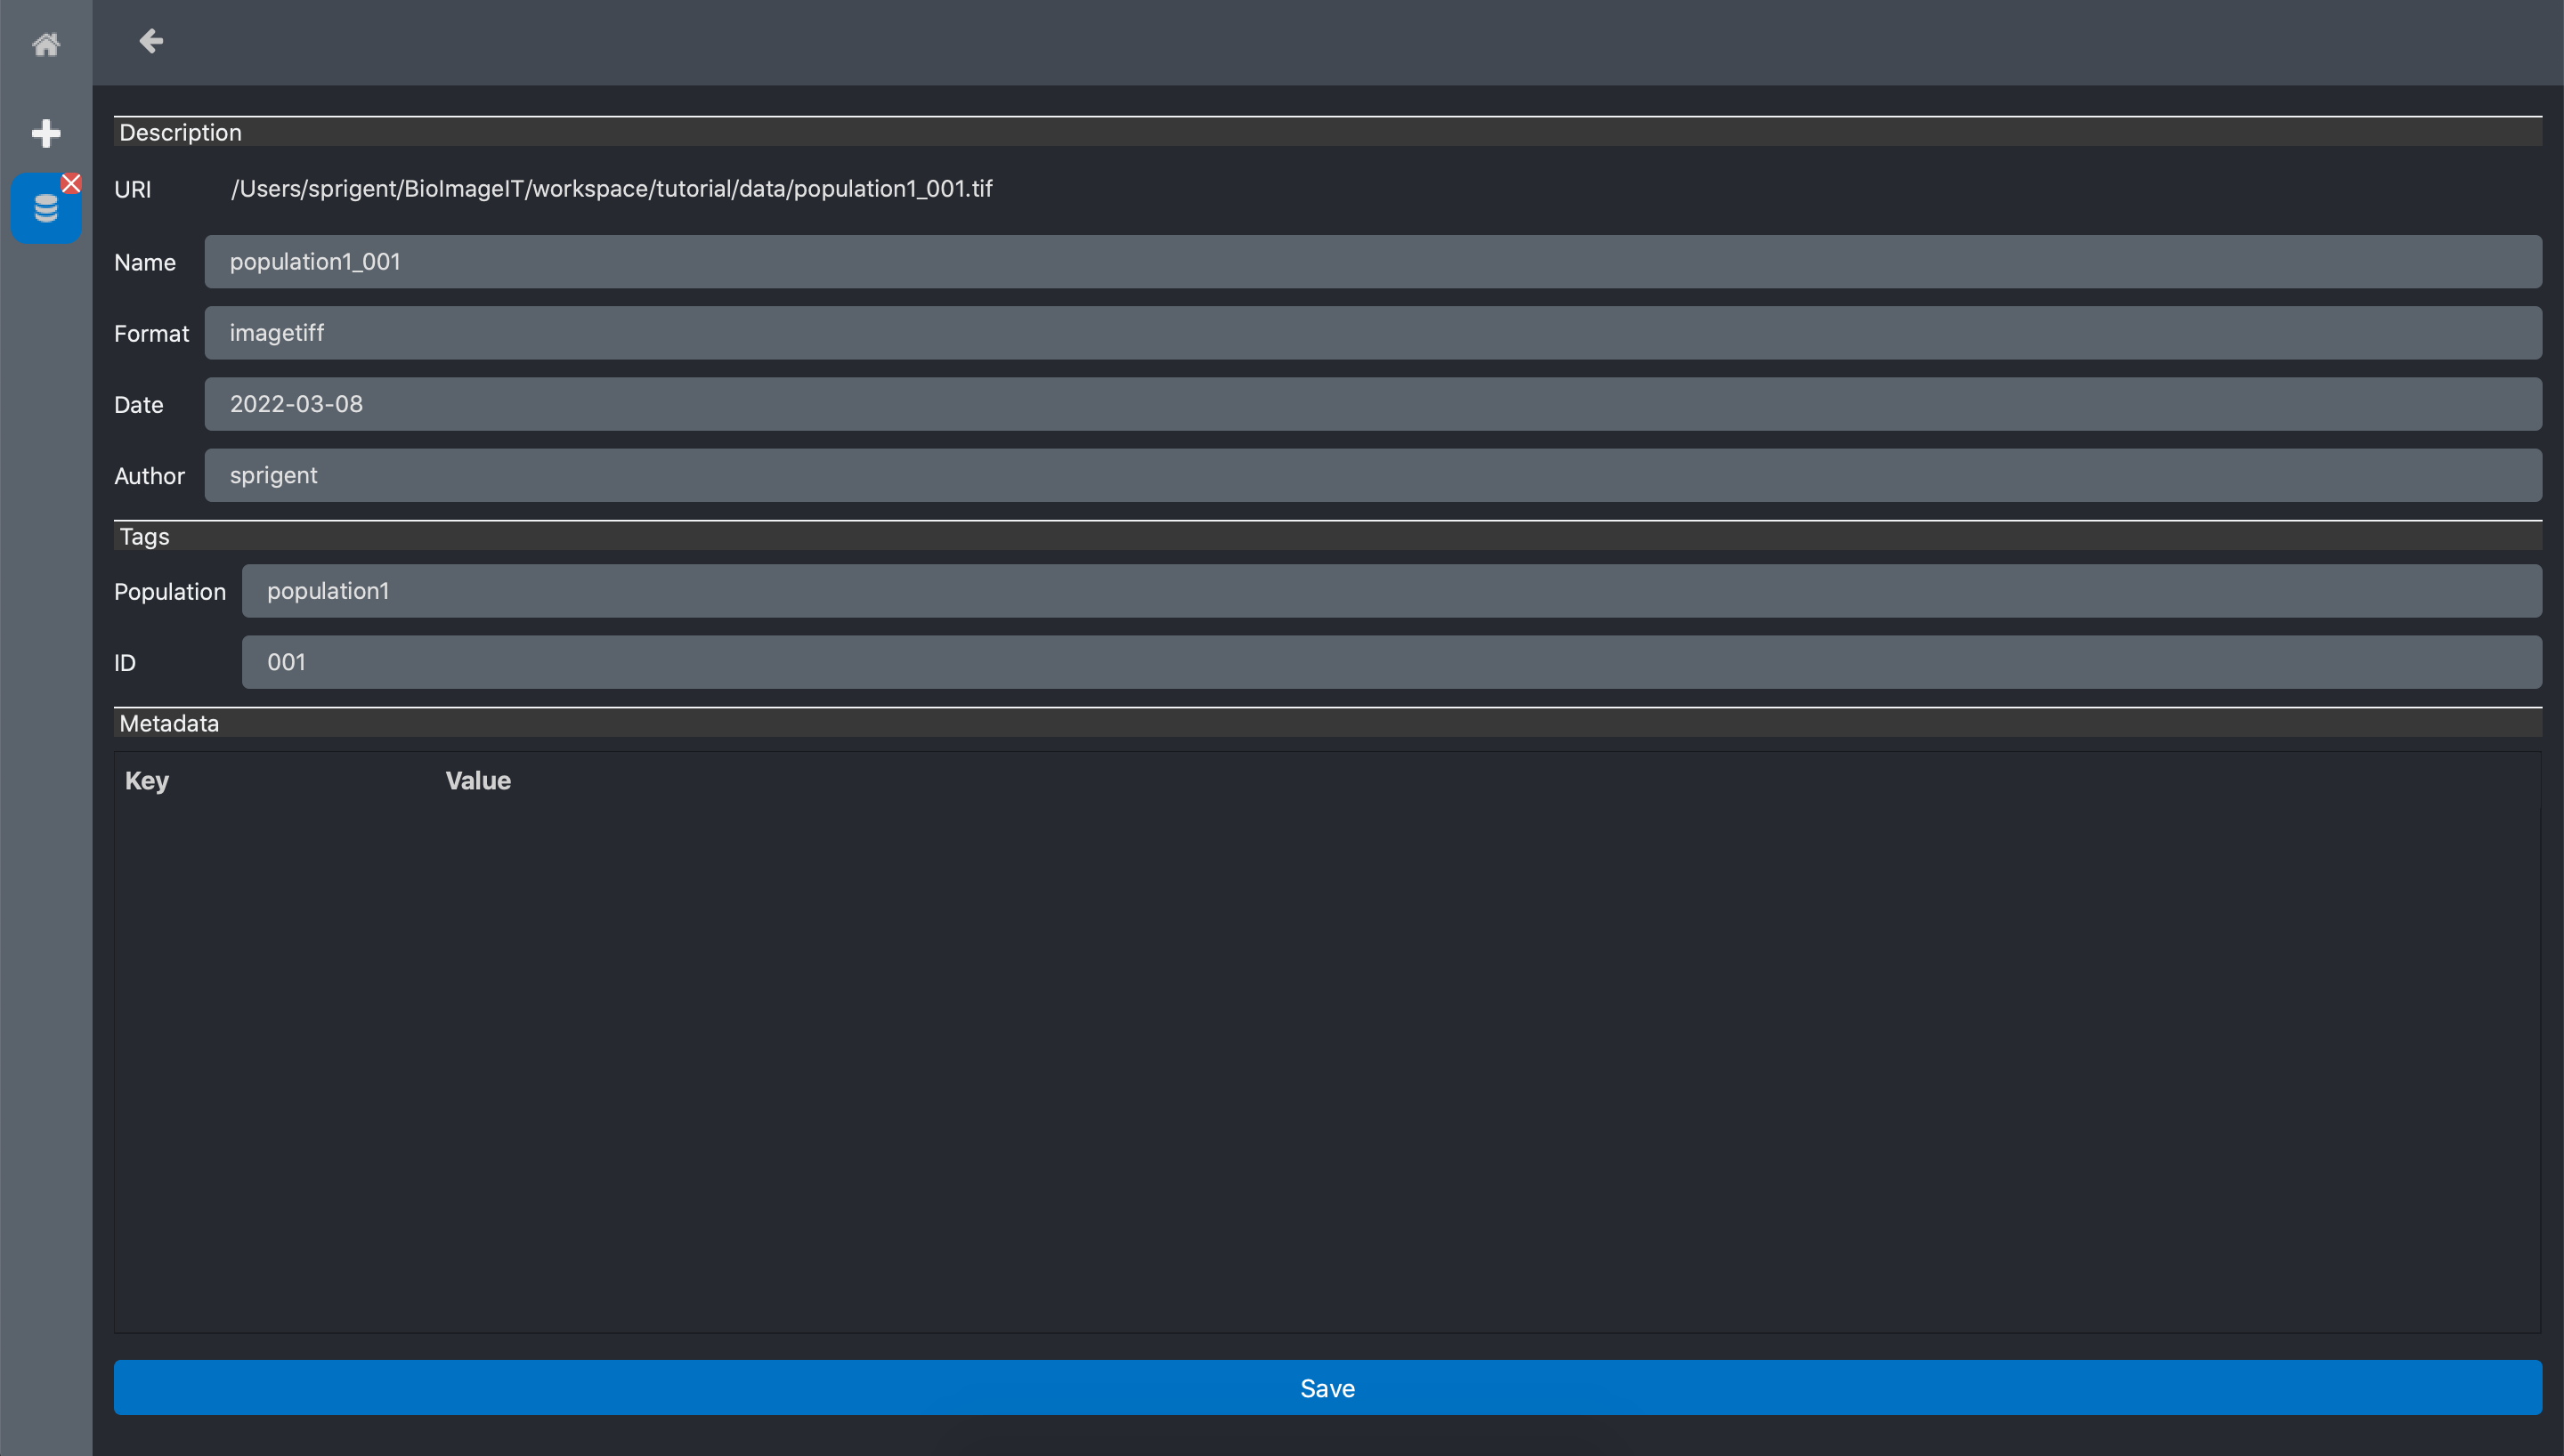
Edit metadata
When we click the Metadata button of any data in the table, a form opens with the list of all
the metadata. Some metadata are editable like name, format date, author. The annotations are also
editable.
The section metadata that is empty for your images can contains all the metadata that are readed
at the image import. For example, when importing a image with bioformat, metadata like the image
resolution is extracted and stored in this metadata section. Of course this section is not
editable:
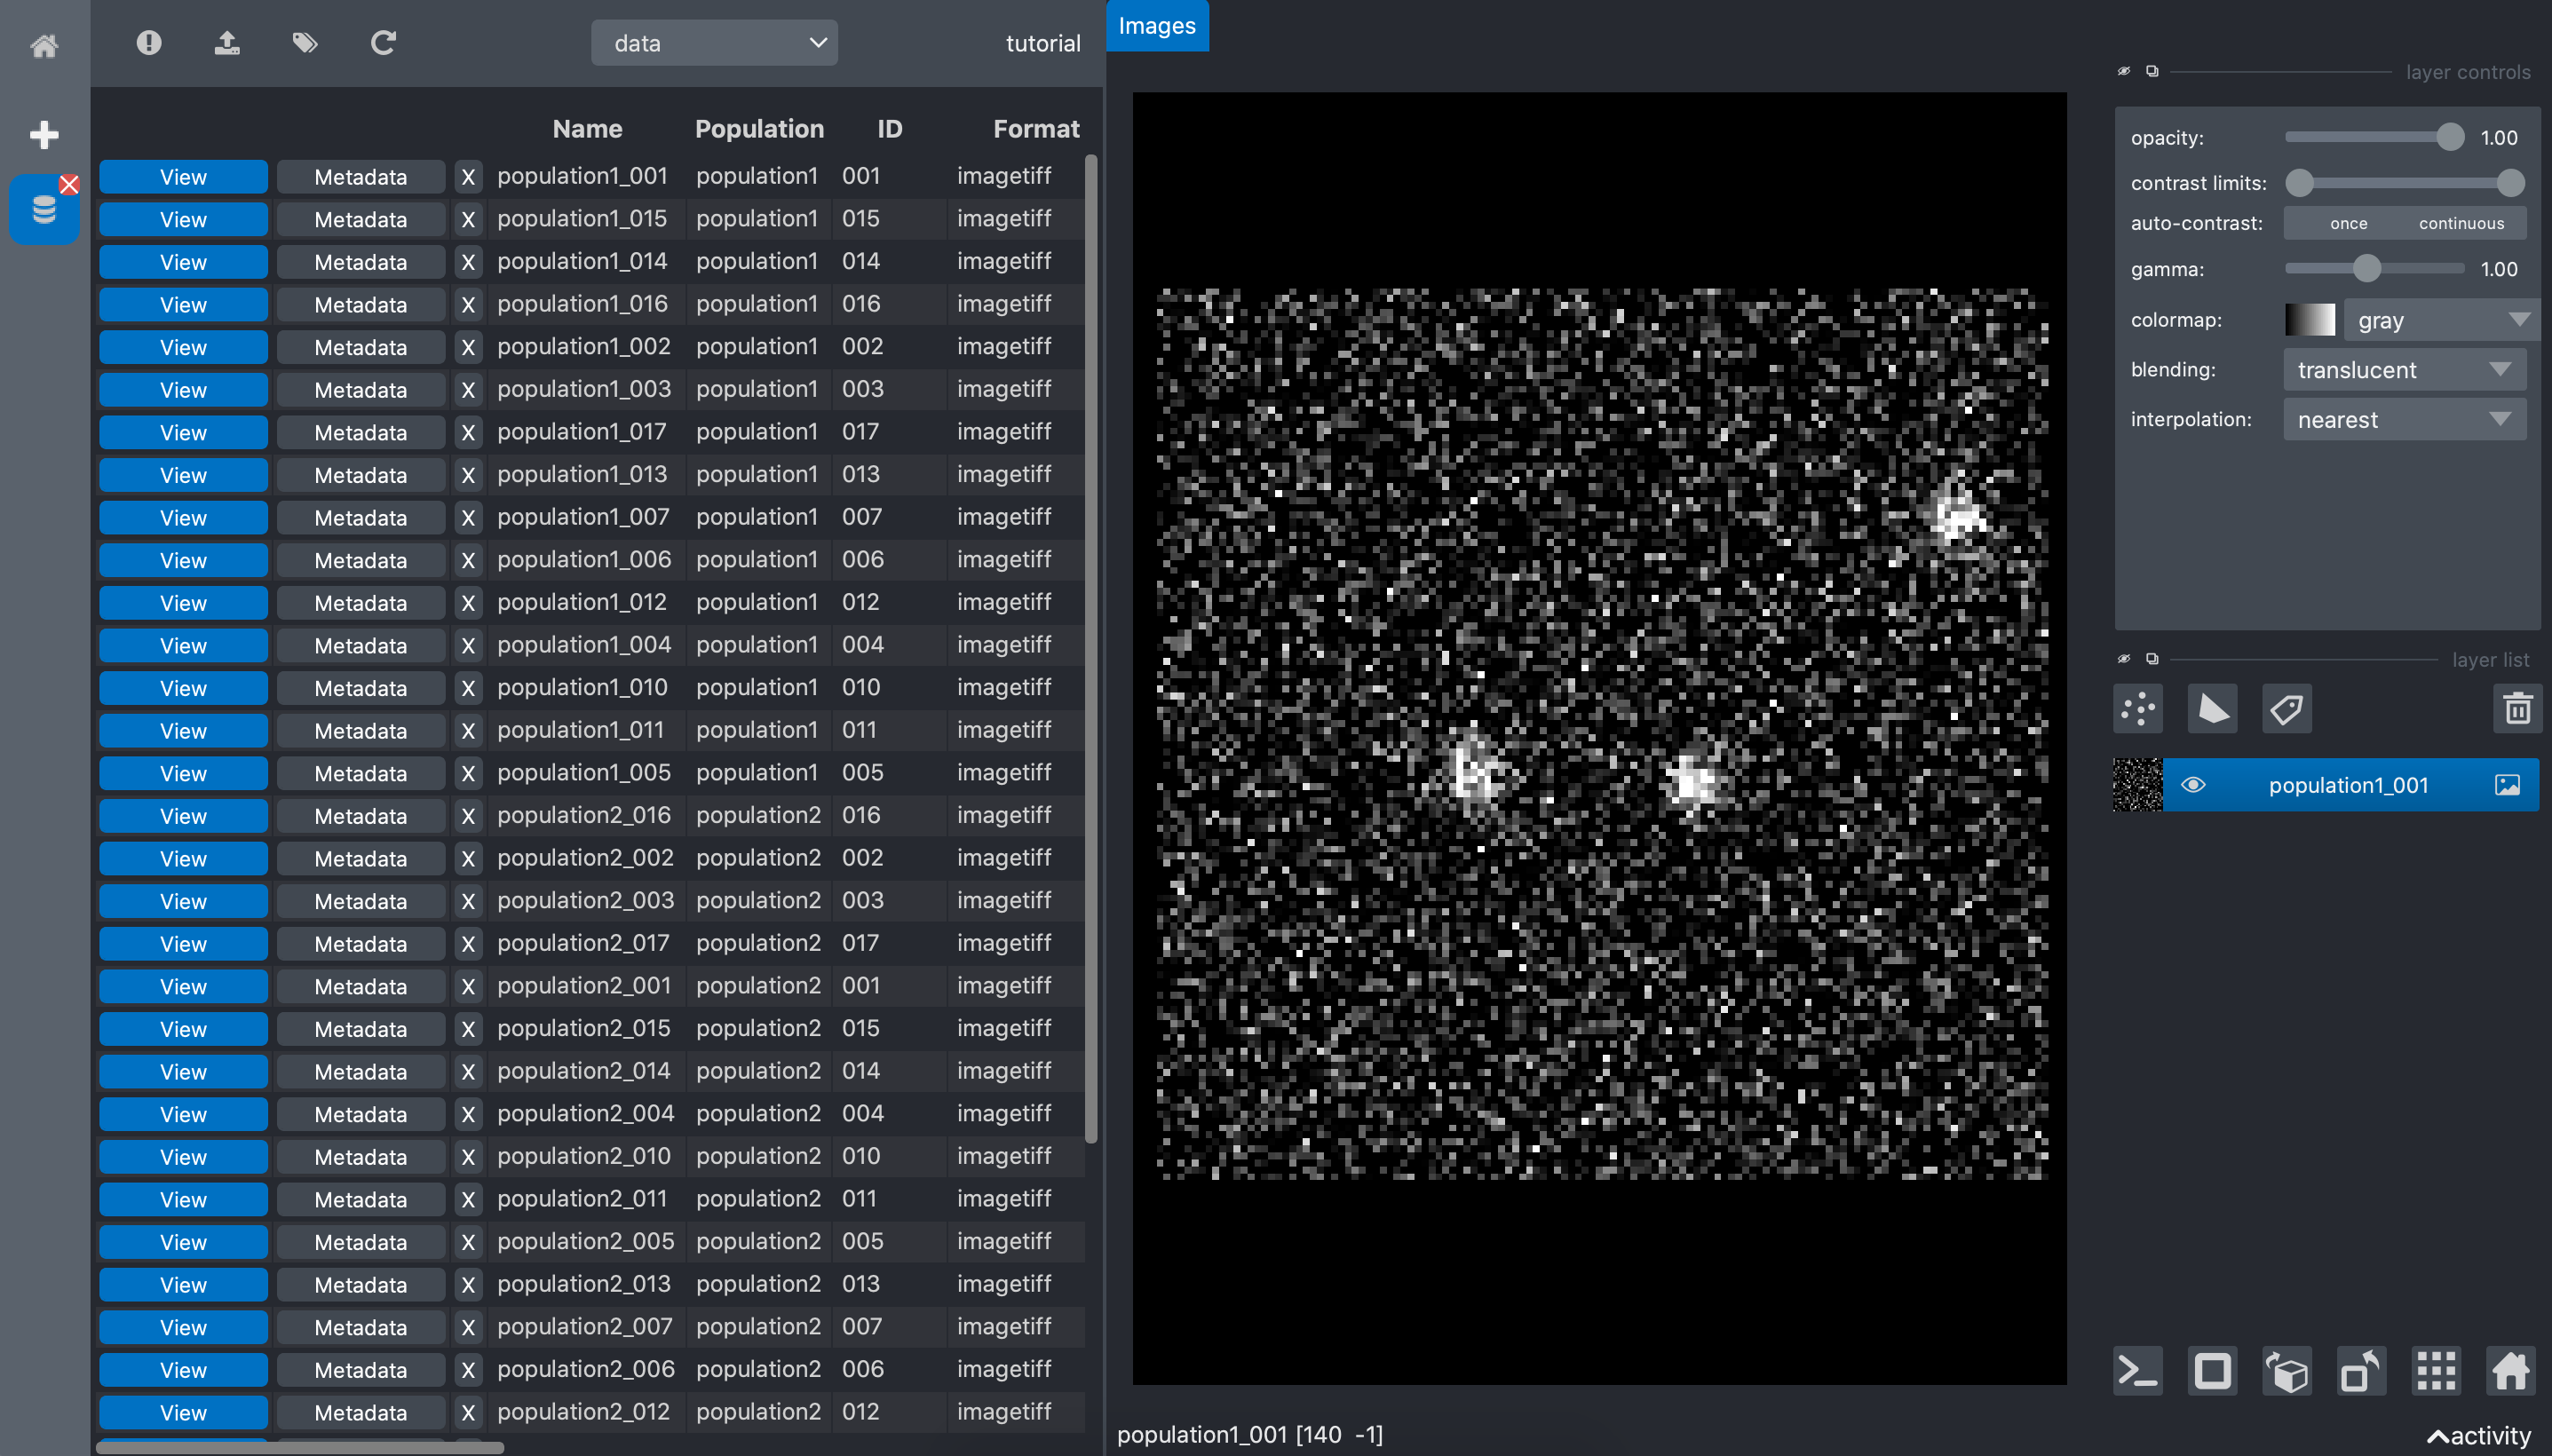
Visualize data
When we double click the View button of any data in the table, it opens a data viewer. The
viewer is different depending on the data format. The data format is specified in each data
metadata.
In our example, the data format are tif. Thus, the browser app opens the napari viewer:
Summary
In this tutorial we saw the main functionalities of the BioImageIT app for data management:
Create an experiment
import data to an experiment
annotate an experiment data
edit data metadata
visualize data
In the next tutorial data analysis, we are going to create a pipeline to analyse this dataset.